Kuvatakse päringule Kiviõli vastavad postitused asjakohasuse alusel. Sortimine kuupäeva alusel Vaadake kõiki postitusi
Kuvatakse päringule Kiviõli vastavad postitused asjakohasuse alusel. Sortimine kuupäeva alusel Vaadake kõiki postitusi
Paper: The future of oil shale mining related to the mining and hydrogeological conditions in the Estonian deposit
txt: 104 Doctoral school of energy- and geo-technology January 15–20, 2007. Kuressaare, Estonia The Future of Oil Shale Mining related to the mining and hydrogeological conditions in the Estonian deposit Abstract Due to high oil price in 2005 number of oil shale mining claims were requested by mining companies in Estonia, which is indicator of rapid oil shale mining development. There will be new mines opened in near future which causes changes in environmental conditions, mainly decrease of water level. Estonia is leading Oil shale mining country in the world. Oil shale has been mined for 90 years, the peak was 31 Mt in 1981 and has stabilised in level of 13 Mt annually in recent years. 95% of Estonian electricity is generated in oil shale power plants. About 20% of mined oil shale is used for oil and chemical production Keywords Mining, oil shale, hydrogeology, technology, modeling, GIS. Introduction Mining is performed equally in underground and surface mines accordingly with room and pillar and open cast mining with draglines. In low bedding surface mines, mechanical extraction with shovel- truck operations is used. Traditional depth in low surface mines is up to 15 m, 30m in open cast mines and 80 m in underground mines. Oil shale seam thickness is stable – 2,8 m, the layers are intersecting with hard limestone layers making selective mining or enrichment obligatory for getting required quality. 1 Modelling Modelling is relatively new approach for planning new and analysing abandoned mines. Modelling itself is convenient way for choosing and selecting and visualising the results but deciding for optimal modelling method and software is complicated task. There are three main tasks for modelling to solve: • Mining technology • Mining development • Mining influence 2 Technological modelling For modelling environmental influence mining locations and advancing speed are required. Depending on mining conditions, possible technology, availability of equipment and their productivity, mining areas were chosen. The main criteria for redistricting the deposit are possible mining technologies in certain mining conditions. The main criterion is thickness of overburden. Since the advancing speed of mining front depends on mining technology and its geometric parameters, the technology has to be modelled for expecting geometric parameters. Geometric models with GIS model allow easily explaining suitable mining technologies in every certain location. Strip and room-and-pillar mining were modelled with Excel software Visual Basic. In addition Surpac, Encom Discover and Modflow software were used for local cases. 3 Spatial modelling Because of big amount of available drill hole and survey data, GIS and mining modelling systems were used to solve spatial task. Spatial distribution and geographical data were retrieved with Vertical Mapper package. (Fig.1.) For further visualisation of geological data and mined areas Surpac Vision and Encom Discover were used. Ahtme2 Tammiku3 Ahtme4 Estonia5 Estonia 4 Surface mining areaAhtme3 Sirgala1 Ahtme1 Narva1 2Sirgala2 Estonia2 Sirgala3 8 Puhatu1 Underground mining area 9 1 7 Narva2 4 5 3 Puhatu2 Puhatu4 6 Permiskula1 Puhatu3 Puhatu5 Fig. 1. Possible technologies in mining fields depending on the given criteria More expensive or not practiced mining technologies in Estonian oil shale deposit give great increase in surface mining area and different mining influence according to water regime and landscape. Kohtla-Järve Kohtla-Järve Kohtla-Järve Kohtla-Järve Kohtla-Järve Kohtla-Järve Kohtla-Järve Kohtla-Järve Kohtla-Järve UljasteUljasteUljasteUljasteUljasteUljasteUljasteUljaste UljastePõhja-Kiviõli Põhja-Kiviõli Põhja-Kiviõli Põhja-Kiviõli Põhja-Kiviõli Põhja-Kiviõli Põhja-Kiviõli Põhja-Kiviõli Põhja-Kiviõli Vana Vana Vana Vana Vana Vana Vana Vana Vana Kohtla Kohtla Kohtla Kohtla Kohtla Kohtla Kohtla Kohtla Kohtla AiduAiduAiduAiduAiduAiduAiduAidu AiduSondaSondaSondaSondaSondaSondaSondaSonda SondaNarvaNarvaNarvaNarvaNarvaNarvaNarvaNarvaNarva SeliSeliSeliSeliSeliSeliSeliSeli SeliPeipsiPeipsiPeipsiPeipsiPeipsiPeipsiPeipsiPeipsiPeipsi Fig. 2. Development plan of Estonian oil shale mining areas, grid 5×5km 4 Hydrogeological modelling Due to the low mineral deposits and highly permeable overburden the groundwater has strong influence to oil shale mining, inhabitants and nature. Taking into consideration similar geological conditions, thickness of limestone overburden and bottom layer of the oil shale, the water level and drainage radius were interpolated with MapInfo Vertical Mapper software between measured observation well values. The model visualises mining advancing and changes in decreased water level until the year 2025 when four new mines will be developed. Generated models gave the possibility to give prediction about the wetlands or nature reserve areas what could be affected by mining activity and which mining technologies should be used for decreasing mining influence. Retrieved data gives boundary conditions for dynamic modelling with Visual Modflow software. Water level models show the relation of abandoned mines and water flow in mined area (Fig. 4.). In addition to modelling, surface miner was tested as landscape designing tool – creating new lake and river areas. Creating infiltration dams during stripping operations were tested to decrease drainage radius of the mine. Both tests showed good results for sustainable mining operations and gave data for further modelling. Ten oil shale mines in the middle of the deposit have been closed. Water level restoring in these mines gives good practical experience for expecting water level in the neighbourhood of future mines. In addition to good analysing possibilities the 3D models helps to explain water situation to the concerned people. (Fig. 3.) Open cast mining with draglines and conveyor bridges and combined stripping methods with excavators and bulldozers allow increasing mineable overburden thickness and moving mines in southern direction. (Fig. 1.) The development plan was chosen after analysing all potential technologies, risks and expenses. The plan allows evaluating environmental and social impacts of mining until year 2025. (Fig. 2.) Mined out area Surface mines Kukruse Kukruse Kukruse Kukruse Kukruse Kukruse Kukruse Kukruse Kukruse Käva 2Käva 2Käva 2Käva 2Käva 2Käva 2Käva 2Käva 2Käva 2 Küttejõu Küttejõu Küttejõu Küttejõu Küttejõu Küttejõu Küttejõu Küttejõu Küttejõu KiviõliKiviõliKiviõliKiviõliKiviõliKiviõliKiviõliKiviõliKiviõli Mining development until 2025 Kaevandus Kaevandus Kaevandus Kaevandus Kaevandus Kaevandus Kaevandus Kaevandus Kaevandus 2 2 2 2 2 2 2 2 2 Kaevandus Kaevandus Kaevandus Kaevandus Kaevandus Kaevandus Kaevandus Kaevandus Kaevandus 4 4 4 4 4 4 4 4 4 KohtlaKohtlaKohtlaKohtlaKohtlaKohtlaKohtlaKohtla KohtlaTammiku Tammiku Tammiku Tammiku Tammiku Tammiku Tammiku Tammiku Tammiku Surface mines Uus Uus Uus Uus Uus Uus Uus Uus Uus Kiviõli Kiviõli Kiviõli Kiviõli Kiviõli Kiviõli Kiviõli Kiviõli Kiviõli SompaSompaSompaSompaSompaSompaSompaSompa SompaViruViruViruViruViruViruViruViruViru AhtmeAhtmeAhtmeAhtmeAhtmeAhtmeAhtmeAhtmeAhtme OjamaaOjamaaOjamaaOjamaaOjamaaOjamaaOjamaaOjamaa Ojamaa Mining in 2006 OanduOanduOanduOanduOanduOanduOanduOanduOanduEstonia Estonia Estonia Estonia Estonia Estonia Estonia Estonia Estonia TuduTuduTuduTuduTuduTuduTuduTudu TuduPuhatuPuhatuPuhatuPuhatuPuhatuPuhatuPuhatuPuhatuPuhatu Underground mines Permisküla Permisküla Permisküla Permisküla Permisküla Permisküla Permisküla Permisküla Permisküla Haljala2 Haljala2 Haljala2 Haljala2 Haljala2 Haljala2Haljala2 Haljala2 Haljala2 Haljala4 Haljala4 Haljala4Haljala4 Haljala4 Haljala4Haljala4 Haljala4 Haljala4 UbjaUbjaUbjaUbjaUbjaUbjaUbjaUbjaUbja Tammiku Tammiku Tammiku Tammiku Tammiku Tammiku Tammiku Tammiku Tammiku Kohtla Kohtla Kohtla Kohtla Kohtla Kohtla Kohtla Kohtla Kohtla mine mine mine mine mine mine mine mine mine Tammiku3 Tammiku3 Tammiku3 Tammiku3 Tammiku3 Tammiku3 Tammiku3 Tammiku3 Tammiku3 Estonia5 Estonia5 Estonia5 Estonia5 Estonia5 Estonia5 Estonia5 Estonia5 Estonia5 Fig. 3. Water level model in mining area in year 2005 Käva 1Käva 1Käva Käva 1Käva Käva Käva 1Käva 1Käva Käva 2Käva Käva Käva Käva Käva Käva 2Käva Käva 111 1Kukruse Kukruse Kukruse Kukruse Kukruse Kukruse Kukruse Kukruse Kukruse 2222 222Põhja-Kiviõli Põhja-Kiviõli Põhja-Kiviõli Põhja-Kiviõli Põhja-Kiviõli Põhja-Kiviõli Põhja-Kiviõli Põhja-Kiviõli Põhja-Kiviõli surface surface surface surface surface surface surface surface surface mine mine mine mine mine mine mine mine mine Vanaküla Vanaküla Vanaküla Vanaküla Vanaküla Vanaküla Vanaküla Vanaküla Vanaküla Kohtla Kohtla Kohtla Kohtla Kohtla Kohtla Kohtla Kohtla Kohtla surface surface surface surface surface surface surface surface surface Mine Mine Mine Mine Mine Mine Mine Mine Mine 2 2 2 2 2 2 2 2 2 mine mine mine mine mine mine mine mine mine nr nr nr nr nr nr nr nr nr 4 4 4 4 4 4 4 4 4 KiviõliKiviõliKiviõliKiviõliKiviõliKiviõliKiviõliKiviõli KiviõliAidu Aidu Aidu Aidu Aidu Aidu Aidu Aidu Aidu surface surface surface surface surface surface surface surface surface mine mine mine mine mine mine mine mine mine SompaSompaSompaSompaSompa SompaSompaSompaSompaMine Mine Mine Mine Mine Mine Mine Mine Mine nr nr nr nr nr nr nr nr nr 2 2 2 2 2 2 2 2 2 Tammiku Tammiku Tammiku Tammiku Tammiku Tammiku Tammiku Tammiku Tammiku Aidu1BAidu1BAidu1BAidu1BAidu1BAidu1BAidu1BAidu1B Aidu1BViru Viru Viru Viru Viru Viru Viru Viru Viru mine mine mine mine mine mine mine mine mine AhtmeAhtmeAhtmeAhtmeAhtmeAhtmeAhtmeAhtme AhtmeEstonia Estonia Estonia Estonia Estonia Estonia Estonia Estonia Estonia mine mine mine mine mine mine mine mine mine Kohtla Kohtla Kohtla Kohtla Kohtla Kohtla Kohtla Kohtla Kohtla 1 1 1 1 1 1 1 1 1 Ahtme1 Ahtme1 Ahtme1Ahtme1 Ahtme1 Ahtme1Ahtme1Ahtme1Ahtme1 Ojamaa3 Ojamaa3 Ojamaa3 Ojamaa3 Ojamaa3 Ojamaa3 Ojamaa3 Ojamaa3 Ojamaa3 Viru2Viru2Viru2Viru2Viru2Viru2Viru2 Viru2Viru2Viru1AViru1AViru1AViru1AViru1AViru1AViru1AViru1A Viru1A Fig. 4. Water level model in oil shale mining area 5 Hydrogeochemical modelling Geochemical processes which determine seasonal variations were examined in 1979-1981 [8]. The mine water in closed mine were affected by sulphide oxidation. During the mining processes pyrite (FeS2) had been extensively mixed with air oxygen. Oxygen is a master variable in pyrite oxidation [9]. It acts directly in oxidizing the sulphide and the iron (II) as shown by the reaction [10, 11] FeS2 + 7/2O2 + H2O –> Fe2+ 2 SO42- + 2 H+ (1) or indirectly by generating Fe(III) which then oxidizes pyrite. The reaction formulas are as follows FeS2+14Fe3+ +8H2O –> 15Fe2+ + 2SO42- +16H+ (2) Fe2+ + 1/4O2 + H+ –> Fe3+ + 1⁄2 H2O (3) The dissolution of pyrite leads to high concentrations of sulphates. The water displayed neutral pH and positive Eh in the spring-summer than in other times [8]. These results reflect the increasing of the sulphide oxidation rate during the warm months, other time the sulphide oxidation rate was low, but depend on precipitation. During mining the water level drowning and increasing aeration zone cause intensive pyrite oxidation, which is the biggest groundwater pollution problem associated with underground mining. After mine closure the water level rising and pyrite oxidation decrease. The most noticeable change will take place in the sulphate content. Haljala6 Haljala6 Haljala6Haljala6 Haljala6 Haljala6 Haljala6 Haljala6 Haljala6 Haljala3 Haljala3 Haljala3Haljala3 Haljala3 Haljala3Haljala3 Haljala3 Haljala3 Kohala1+4 Kohala1+4 Kohala1+4 Kohala1+4 Kohala1+4 Kohala1+4 Kohala1+4 Kohala1+4 Kohala1+4 Kohala2+5 Kohala2+5 Kohala2+5 Kohala2+5 Kohala2+5 Kohala2+5 Kohala2+5 Kohala2+5 Kohala2+5 Pada3+4 Pada3+4 Pada3+4 Pada3+4 Pada3+4 Pada3+4 Pada3+4 Pada3+4 Pada3+4 I I I' Rakvere6 Rakvere6 Rakvere6 Rakvere6 Rakvere6 Rakvere6 Rakvere6 Rakvere6 Rakvere6 Rakvere8 Rakvere8 Rakvere8 Rakvere8 Rakvere8 Rakvere8 Rakvere8 Rakvere8 Rakvere8 Tudu2Tudu2Tudu2Tudu2Tudu2Tudu2Tudu2Tudu2 Tudu2Jõhvi Pada5Pada5Pada5Pada5Pada5 Pada5Pada5Pada5Pada5Uljaste1 Uljaste1 Uljaste1Uljaste1 Uljaste1 Uljaste1Uljaste1 Uljaste1 Uljaste1 Pohja-Kivioli1 Pohja-Kivioli1 Pohja-Kivioli1 Pohja-Kivioli1 Pohja-Kivioli1 Pohja-Kivioli1 Pohja-Kivioli1 Pohja-Kivioli1 Pohja-Kivioli1 Pohja-Kivioli2 Pohja-Kivioli2 Pohja-Kivioli2 Pohja-Kivioli2 Pohja-Kivioli2 Pohja-Kivioli2 Pohja-Kivioli2 Pohja-Kivioli2 Pohja-Kivioli2 Kiviõli Püssi Rakvere Kohala3 Kohala3 Kohala3 Kohala3 Kohala3 Kohala3 Kohala3 Kohala3 Kohala3 Sonda7 Sonda7 Sonda7 Sonda7Sonda7 Sonda7 Sonda7 Sonda7 Sonda7 Rakvere5 Rakvere5 Rakvere5 Rakvere5 Rakvere5 Rakvere5 Rakvere5 Rakvere5 Rakvere5 Kabala4 Kabala4 Kabala4 Kabala4 Kabala4 Kabala4 Kabala4 Kabala4 Kabala4 Sonda1 Sonda1 Sonda1Sonda1 Sonda1 Sonda1Sonda1 Sonda1 Sonda1 Sonda2 Sonda2 Sonda2Sonda2 Sonda2 Sonda2 Sonda2 Sonda2 Sonda2 Uus-Kivioli1 Uus-Kivioli1 Uus-Kivioli1 Uus-Kivioli1 Uus-Kivioli1 Uus-Kivioli1 Uus-Kivioli1 Uus-Kivioli1 Uus-Kivioli1 Ahtme3 Ahtme3 Ahtme3Ahtme3 Ahtme3 Ahtme3Ahtme3 Ahtme3 Ahtme3 Kabala3 Kabala3 Kabala3 Kabala3 Kabala3 Kabala3 Kabala3 Kabala3 Kabala3 Sonda5 Sonda5 Sonda5 Sonda5 Sonda5 Sonda5Sonda5 Sonda5 Sonda5 Sonda3 Sonda3 Sonda3Sonda3 Sonda3 Sonda3 Sonda3 Sonda3 Sonda3 Sonda4 Sonda4 Sonda4Sonda4 Sonda4 Sonda4 Sonda4 Sonda4 Sonda4 Uus-Kivioli2 Uus-Kivioli2 Uus-Kivioli2 Uus-Kivioli2 Uus-Kivioli2 Uus-Kivioli2 Uus-Kivioli2 Uus-Kivioli2 Uus-Kivioli2 Uus-Kivioli3 Uus-Kivioli3 Uus-Kivioli3 Uus-Kivioli3 Uus-Kivioli3 Uus-Kivioli3 Uus-Kivioli3 Uus-Kivioli3 Uus-Kivioli3 Ojamaa1 Ojamaa1 Ojamaa1 Ojamaa1 Ojamaa1 Ojamaa1 Ojamaa1 Ojamaa1 Ojamaa1 Ojamaa2 Ojamaa2 Ojamaa2 Ojamaa2 Ojamaa2 Ojamaa2 Ojamaa2 Ojamaa2 Ojamaa2 Estonia2 Estonia2 Estonia2 Estonia2 Estonia2 Estonia2 Estonia2 Estonia2 Estonia2 m Tudu1Tudu1Tudu1Tudu1Tudu1Tudu1Tudu1Tudu1 Tudu1Oandu2Oandu2Oandu2Oandu2Oandu2 Oandu2Oandu2Oandu2Oandu2 Oandu3Oandu3Oandu3Oandu3Oandu3 Oandu3Oandu3Oandu3Oandu3 Sonda6 Sonda6 Sonda6Sonda6 Sonda6 Sonda6 Sonda6 Sonda6 Sonda6 Estonia1 Estonia1 Estonia1 Estonia1 Estonia1 Estonia1 Estonia1 Estonia1 Estonia1 , levSeli2Seli2Seli2Seli2Seli2Seli2Seli2Seli2 Seli2Seli1Seli1Seli1Seli1Seli1Seli1Seli1Seli1 Seli1Estonia3 Estonia3 Estonia3 Estonia3 Estonia3 Estonia3 Estonia3 Estonia3 Estonia3 elOandu4Oandu4Oandu4Oandu4Oandu4Oandu4Oandu4 Oandu4Oandu4Oandu5Oandu5Oandu5Oandu5 Oandu5Oandu5Oandu5Oandu5Oandu5 Cross Section Oandu6Oandu6Oandu6 I-I' a 80 ese 70ht60m orft Oandu1Oandu1Oandu1Oandu1Oandu1 Oandu1Oandu1Oandu1Oandu1 5040hgi30eH200 5000 10000 15000 20000 25000 30000 35000 40000 45000 50000 Distance, m 105 closed Evidently, the rise of sulphate anions (Fig. 5.) in mines it is low (Fig. 7.). The water washes water has been caused by oxidation of pyrite in well- the already oxidising pyrite products out of the aerated water, which percolates down through the limestone and the sulphate content in groundwater overburden. In the water, which fills underground will increase. The sulphate may distribute in a lateral mines, the content of this element is high (Fig. 5. – direction many times higher than in transversal Ahtme mine), but lowering and still stays 10 times direction. This may be explained with the higher than its natural background. permeability of groundwater aquifer or aquifer This is naturally accompanied by intensive removal of the sulphates recharging Ordovician carbonate system. Sulphate distribution in underground mine water in 2003 is shown in Fig. 7A. rocks. Significant enrichment of water with the In 2003, in the earliest closed underground mines sulphates takes place in the carbonate rocks in the (Kukruse, Mine no 2) the sulphate content was high aeration zone. There is increasing evidence that in the Lasnamäe–Kunda aquifer. In the western part portions of the water infiltrating through the soil of Tammiku mine the Lasnamäe–Kunda aquifer was surface may move rapidly through the aeration zone very high in sulphate (Fig. 10B). This is promoted along preferred flow paths such as macrospores and by karst and technogenic faults. The Ahtme mine fractures. In many cases, the water has low pH and water pool exerted a weak influence on the contains elevated levels of sulphate ions. Lasnamäe–Kunda aquifer. In the southern part of In recent years, in the area of oil shale mines, the chemical composition of groundwater has been stable. The content of SO4 in groundwater was 2 times higher in spring (Fig. 6.) than during the remaining seasons of the year. It can be caused by dissolution of pyrites in oxygen-abundant water in spring. Kohtla mine and in the northern part of Sompa mine the sulphate content in the Lasnamäe–Kunda aquifer was between 200-320 mg/l. Mine no 4 and also Käva mine pools water amount in the Lasnamäe– Kunda was lower, than in the other mines. In this region a relatively impermeable aquitard may be located between mine pool area and the Lasnamäe– Kunda aquifer. The distribution of sulphate in the Mine No 4 closed in 1975 and in 1990 it was water Lasnamäe–Kunda aquifer may be due to the filled. Mainly precipitation, groundwater flow from circumstance that the permeability of carbonated each side and rising water level caused fluctuations rock in a lateral direction can be up to 100 times in the sulphate content in Mine No 4. The sulphate higher than in a transversal direction. The same content in the water filling up mine is high; in the effect is observed in the Keila–Kukruse aquifer. 1600 1400 1200 Tammiku Sompa Kohtla Ahtme Sulphate content, mg/l 1000 800 600 400 200 0 2003 2002 2004 Fig. 5. The sulphate content of groundwater in underground mines: Tammiku observation well no 0714; Sompa – 486; Kohtla – 0705; Ahtme – 16122 600 S02.2001 42 500 41l /gm, tnetnoce tahplu400 . l.s.a300 40200 m , levelr etawdnuorG39100 0 03.2001 13804.2001 12.2001 05.2001 01.2001 6.2001 Sulphate Groundwater level Fig. 6. The sulphate content in the water of the underground oil shale Mine no 4 in 2001 106 A B Fig. 7. The sulphate content in the Ordovician Keila–Kukruse aquifer (A) and Lasnamäe–Kunda aquifer (B) of underground oil shale mine area. 5. Conclusions There is no single software package for modelling complicated mining development plan as a country’s main mineral mining in a rapid increase period. All available packages have to be tested from both simplicity and information exchange side and from advanced results and analysing side. The results depend form local conditions like people, geology, mining traditions and software availability. For Estonian Oil Shale mining modelling – in addition to traditional office software, MapInfo, Vertical Mapper and Modflow have shown good results. In addition to analysing capabilities the visualisation aspect has shown strong importance for working with development plans. In closed mine workings form underground water basins with higher sulphate content, which may be exacerbated due to the mining methods and underground mining operations. The main results may be summarized as follows: 1. the hydrogeological regime in oil shale mines is controlled by the thickness of the aeration zone, tectonical faults and fractures in the geological section, alteration of hydraulic gradients causing changes in flow direction and rate; 2. closing and flooding of underground mines has changed the groundwater forming conditions in the Lasnamäe–Kunda aquifer and sulphate content within it; 3. due to technogenic impact the water of closed mines is connected with the Lasnamäe–Kunda aquifer. This study is related to EstSF grant G5913 “Usage of mined out area”. References: 1. Reinsalu Enno, Changes in Mine Dewatering After the Closure of Exhausted Oil Shale Mines, Oil Shale, Estonian Academy Publishers, Tallinn, 2005, 261 – 273 2. Reinsalu Enno, Lind Helena, Valgma Ingo, Technogenic water body in closed oil shale mines, Oil Shale, Estonian Academy Publishers, Tallinn, 2006, - 3. Reinsalu Enno, Valgma Ingo, Geotechnical Processes in Closed Oil Shale Mines, Oil Shale, Estonian Academy Publishers, Tallinn, 2003, 398 – 403 4. Tammeoja Tauno, Oil shale in Estonian power industry, Oil Shale, Estonian Academy Publishers, Tallinn, 2003, 135 – 142 5. Valgma Ingo, An evaluation of technological overburden thickness limit of oil shale open casts ny using draglines, Oil Shale, Estonian Academy Publishers, Tallinn, 1998 6. Valgma Ingo, Estonian oil shale resources calculated by GIS-method, Oil Shale, Estonian Academy Publishers, Tallinn, 2003, 404 – 411 7. Taiex Workshop on EU Legislation as it Affects Mining. Department of Mining of Tallinn University of Technology in co-operation with Society of Mining Professors and TU Bergakademie Freiberg 8. Karise, V., Pill, A., Johannes, E., Erg, K. 1987. Water chemical content forming in Estonian oil shale mining area. Manuscript in Institute of Geology. Tallinn, 286. 9. Perens, R., Andresmaa, E., Antonov, V., Roll, G., Sults, Ü. 2001. Groundwater management in the northern Peipsi-Narva river basin. Background report, seminar ”Support to Estonian-Russian Joint Peipsi-Narva Transboundary Water Commission through Capacity Building and Development of Recommendations” (CEE 008, supported by the Swedish Environmental Protection Agency), Tartu, Estonia April 18-19. 10. Singer P. C., Stumm, W. 1970. Acidic mine drainage: the rate – determining step. – Science, 167, 1121–1123. 11. Erg, K. 2005. Groundwater sulphate content changes in Estonian oil shale mining area. – Oil Shale, 22, 3, 275-289. 107

Artikkel: Kaevandamise mõju põhjavee tasemele
txt:
Põlevkivi potentsiaalsed kaeveväljad ja kaevandamise mõju põhjavee tasemele aastani 2025
Alljärgnevas prognoosis kirjeldame üht põlevkivi kaevandamise arenguversiooni uute
kaevandausalade paiknemise ja veeärastuse seisukohalt.
Põlevkivi kaevandamismaht kasvab prognoosi kohaselt aastaks 2025 poolteist korda. [8] Sellise
nõudluse rahuldamiseks jätkatakse kaevandamist praegustes kaevanduskohtades ja avatakse KoseTammiku,
Ojamaa ning Uus-Kiviõli kaevandus. Lisaks kaevandatakse Viru kaevanduse kaudu Sompa,
Estonia ja Ojamaa välja põlevkivi. Seli väli avatakse Estonia kaevandusest. Aastaks 2025
ammenduvad Narva karjääri põhjapoolsed jaoskonnad ja Kohtla-Vanaküla ning Kose-Tammiku
karjäär.
Vedu ja infrastruktuur ühendatakse praeguste kaevandustega. Uus-Kiviõli ja Ojamaa kaevandused
kasutavad stollide kaudu Aidu karjääri rikastusvabrikut ja laadimissõlme.
Kaevandamistehnoloogia uuendusteks on lühieekombainidega kaevandamine Ojamaa ja Seli väljadel
ning kaasaegsete laavakombainidega lankkaevandamine Uus-Kiviõli ja Usnova (Narva karjäärivälja
kaguosa) väljadel.
1.1. Prognoosi meetodid
Kaevandatavate alade valiku kriteeriumid sõltuvad tehnoloogilistest ja teistest –
keskkonnakaitselistest, sotsiaalsetest ja kultuurilisest piirangutest. Kaevandamiskohtade ja -mahtude
otsused sõltuvad majandusnäitajatest ja seega eelnevatest piirangutest ning kauba e. müüdava
põlevkivi kvaliteedist.
Võimalike kaevandamiskohtade ja kaevejärkude prognoosimiseks lähtutakse kas konstantsest
toodangust, reaalsest prognoositavast tarbimisest või analüüsides kõikide kaevandusjaoskondade
reaalseid mäendustingimusi, võimalikku tehnoloogiat ja optimaalset kaevandamismahtude jaotamist
(Tabel 1).
Tabel 1 Kaevandamismahtude prognoosi meetodid
Meetod Konstantne,
üldine
Prognoositav Tegelikkusele lähedane
Prognoosi alus Aluseks on
praegune
kaevandamismaht.
Säilitatakse sama.
Kehtib seal kus
tootmismahu
tehnoloogilisi
piiranguid ei ole.
Aluseks on maksimaalne
võimalik
kaevandamismaht mingi
tehnoloogia korral, ühes
jaoskonnas.
Aluseks kohalikud
kogemused ja innovaatilised
lahendused. Arvestatakse
kõiki piiranguid ja
mäendustingimusi.
Plokk Kaevandamata
kaeveväli või
uuringuväli
Jaoskonniti, lähtudes
tehnoloogilise ploki
optimaalsest suuruses
Konkreetsed
kaevandusjaoskonnad,
piirangud, olemasolevad
masinad.
Tootlikkus, t/a Faktiline, mis oli
2005 a.
Pikema perioodi jooksul
trend, mis selles
jaoskonnas oli. Arvestab
katenditegurit ja
tootlikkuse langust
avakaevandamisel.
Arvestab projektlahendustes
toodud piirangud. Tootlikkus
on jaoskonniti ja aastati
erinev.
Kihindi tootlus,
t/m2
Maardla ruumilisest
mudelist
Maardla ruumilisest
mudelist ja ametlikest
aruannetest
Maardla ruumilisest mudelist,
aruannetest ja jaoskondade
analüüsi tulemused
Varu, Mt Tootlus*pindala Tootlus*pindala Tootlus*pindala
Kaevandamise
kestus
Varu / tootlikkus
/(1-kadu)
Varu / tootlikkus /(1-
kadu)
Varu / tootlikkus /(1-kadu)
2
Tulemus Maksimaalne
võimalik saagis
Tehniline võimalik saagis Tegelik saagis
Vastavalt prognoosile suureneb põlevkivi vajadus vastavalt tarbijate lisandumisele. Prognoosist
lähtudes suureneb põlevkivi tootmismaht aastaks 2025 poolteist korda (Tabel 2) [9].
Tabel 2 Põlevkivi vajaduse prognoos, Mt/a
Aasta Mt/a
2005 14,1
2010 17,5
2015 18,8
2020 20,2
2025 21,8
Kaevandamiskohtade prognoosimiseks on aluseks võetud praegused kaevandamiskohad (Joonis 1).
Eeldusel, et varu olemasolul jätkatakse praegustes kohtades kaevandamist, saame prognoosida
kaevejärkude edasist arengut kaevandamata ala suunas.
Kiviõli
Estonia
Ahtme
Kaevandus 2
Käva 2
Kaevandus 4
Kohtla
Sompa
Viru
Tammiku
Küttejõu
Puhatu
Oandu
Uus Kiviõli
Ojamaa
Kabala
Tudu
Kohala Uljaste Põhja-Kiviõli
Sonda
Seli
Pada
Pada
Estonia
Estonia
Aidu
Narva
Kohtla-Järve
Vana Kohtla
Joonis 1 Kaevandamisjaoskonnad 2004-2005 aastal. Kaeveväljad, kaevandatud alad, ristviirutusega 2004-
2005. aastal kaevandatud alad. Võrk 5x5km
Kaevandamisalade valikul on lähtutud rajoneerimise aluseks olnud tehnoloogilistest piirangutest.
Alade valikul on arvestatud ka looduskaitselisi ja majanduslikke piiranguid.
1.2. Tehnoloogiline rajoneerimine
Maardla tehnoloogilise rajoneerimine seisneb võimalike kaevandamismoodustele ja -viisidele
sobivate alade määramises. Kaevandamise moodustel ja viisidel ning väljamise ja raimamise
meetoditel on erinev keskkonnamõju.
Põhimõisted
Kaevandamismoodused on ava- ja allmaakaevandamine. Kaevandamisviisid on
avakaevandamisel määratud katendi eemaldamine viisiga, mis võib toimuda kühveldamisega
(ekskaveerimisega), veoga või kombineeritult, s. h puistangusildadega.
Allmaakaevandamisel on kaevandamisviisid kamberkaevandamine, valdavalt maa
hoidmisega ja lankkaevandamine (pikkade etega kaevandamine, laavakaevandamine) maa
langetamisega.
Väljamise meetodid on lausväljamine – rikastamisega, mille hulka kuulub ka õli utmine,
selektiivne / kõrgselektiivne (kihtide freesimine ehk koorimine), esmajoones
avakaevandamisel. Raimamine võib toimuda puur- ja lõhketöödega või mehhaniseeritult
(kombainidega).
3
1.3. Ava- ja allmaakaevandamise alade määramine
Peamised kriteeriumid on avakaevandamise puhul lasumi (katendi) paksus ja
allmaakaevandamise korral lasumi (põhilae) püsivus. Püsivus sõltub lubjakivi kihi paksusest.
Töötavate ja projekteeritavate kaevanduste tehnoloogiate valikukriteeriumid on erinevad.
Üldiselt loetakse kamberkaevandamisele sobivaks ala, kus kihindi väljatav paksus on üle
2,5 m, kuid seda kriteeriumi saab edukalt kasutada vaid iga konkreetse kaevandusvälja kohta
eraldi, arvestades maapealset situatsiooni, eriti kaitstavaid objekte ja -alasid.
Kui töötavates põlevkivikarjäärides kasutatakse katendi teisaldamiseks draglaine, siis seisneb
rajoneerimine selle ala määramises, kus saab nende draglainidega katendit teisaldada, kus
peab kasutama ümberkühveldamist ja kus peab hakkama kasutama abimasinaid.
Projekteeritavate karjääride puhul ei piira valikut olemasolev masinapark, seetõttu võib seal
alustada ka näiteks hüdrauliliste ekskavaatorite ja kalluritega katendi eemaldamist (nt. PõhjaKiviõli
karjäär) või uute süsteemidega, nagu puistangusildadega või kombineeritud
süsteemidega. Olenemata kuludest, on igal süsteemil oma mõistlikud tehnoloogilised
kasutuspiirid. (Tabel 2.1)
Rajoneerimiseks koostati põlevkivikihindi geomeetriline-, kvaliteedi- ja majandusmudel.
Geomeetrilise mudeli moodustavad põlevkivi kihtide, vahekihtide, kaljuse katendi,
poolpehme katendi ja pehme katendi GIS mudelid1
.
Vastavalt tehnoloogiate kasutuspiiridele on valitud alad, mille kohta saab GIS mudelist teha
otsuste langetamiseks vajalikke päringuid.
Traditsiooniline ja põlevkivikarjääride projekteerimisel arvesse võetud kriteerium oli 0...30m
paksune katend, mis määras avakaevanduste kaeveväljade piirid.
Ülejäänud ala oleks sobilik allmaakaevandamiseks, kui püsiva kattekivimi paksus oleks
piisav. Eeldusel, et kombainilaavades saab kaevandada alates 5 m püsiva kattekivimi
(ordoviitsiumi lubjakivi) olemasolu korral ja tulptervikutega kamberkaevandustes alates 10 m,
siis selgub, et idakarjääridest lõunas on ala, kus ei sobi ükski kaevandamisviis. Lõunapoolne
ala sobib vastavalt kattekivimi püsivusele allmaakaevandamiseks ).
Tabel 2.1 Tehnoloogilised piirangud (töötabeli näidis)
Tehnoloogilised kaevandamisviiside
piirangud
Katendi
teisaldus- või
kaevandamiskulu
Pindala,
km2
Umbkaudne
kaevise
kogus, Mt
Tehnoloogia % Hmin, m Hmax, m
Hord_min,
m
Hord_max,
m
Klassikaline avakaevandamiseks sobiv
ala
0 30 401 1362
Vaalkaevandamine draglainidega 100 10 27 310 1053
Vaalkaevandamine draglainidega
ümberkühveldamisega
150 23 27 99 335
Vaalkaevandamine draglainidega
ümberkühveldamisega ja/või
200 25 33 215 732
1
GIS – geoinfosüsteem, GIS mudel – ruumiline, digitaalne, visualiseeritav andmemudel
4
Tehnoloogilised kaevandamisviiside
piirangud
Katendi
teisaldus- või
kaevandamiskulu
Pindala,
km2
Umbkaudne
kaevise
kogus, Mt
buldooseritega
Vaalkaevandamine draglainidega
ümberkühveldamisega ja/või
buldooseritega, + ekskavaator + kallur
300 25 35 278 945
Konveiersildadega katendi teisaldamine 500 30 60 886 3012
Ekskavaator + kallur 200 0 30 401 1362
PLT tulpervik-kamberkaevandamine 100 10 150 10 150 1997 6790
Lankkaevandamine pikaee kombainiga 150 5 2307 7845
Kombainkaevandamine lühieekombainiga 200 10 1997 6790
Vastavalt katendi paksustele (Tabel 2.1), suureneb avakaevandamise ala kulukamate katenditeisaldusmeetodite
kasutamisel (Joonis 2). Enamus aktiivsest põlevkivivarust oleks võimalik kaevandada karjäärides kui kasutataks
näiteks puistangusildasid (Joonis 3).
0
1000
2000
3000
4000
5000
6000
7000
8000
9000
Klassikaline
avakaevandamiseks
sobiv ala
Vaalkaevandamine
draglainidega
Vaalkaevandamine
draglainidega
ümberkühveldamisega
Vaalkaevandamine
draglainidega
ümberkühveldamisega
ja/või buldooseritega
Vaalkaevandamine
draglainidega
ümberkühveldamisega
ja/või buldooseritega, +
ekskavaator + kallur
Konveiersildadega
katendi teisaldamine
Ekskavaator + kallur
PLT tulpervikkamberkaevandamine
Laavakaevandamine
pikaee kombainiga
Kombainkaevandamine
lühieekombainiga
Pindala, km2
Orienteeruv põlevkivikogus, Mt
Joonis 2 Põlevkiviressursi sõltuvus võimalikest kaevandamistehnoloogiatest
Idakarjääridest lõunas piirab pealmaakaevandamist paks katend. Kohati on sellel alal kaljune
(Ordoviitsiumi) lasum liiga õhukene, et kasutada kambritega allkaevandamist.
5
Joonis 3 Kulukamate katenditeisaldusmeetodite kasutamisel suureneb avakaevandamiseks sobilik ala
idakarjäärides. Vastavalt kriteeriumite tabelile on rajoneeritud võimalikud puistangusildadega
kaevandamise alad, kombineeritud ning draglainidega vaalkaevandamise ala.
Allmaakaevandustes määrab plokkide tootlikkuse kasutav tehnoloogia või jaoskondade arv.
Karjäärides määrab väljamismahu katenditeisaldustootlikkus mis on konstantne või langeb sügavates
karjäärides. Tootlikkuse languse põhjus võib olla draglaini tehnilise seisukorra halvenemine ehk
remondipäevade arvu suurenemine aastas, katendikivimite ebapüsivuse suurenemine või katendi
paksuse suurenemine üle draglaini piirkatendi väärtuse.
Kui olemasolevad kaevandused ei suuda nõutavat kogust põlevkivi kaevandada (Joonis 8), siis tuleb
avada uusi jaoskondi või kaevandusi potentsiaalsetel väljadel.
6
Ubja Ubja Ubja Ubja
P-Kiviõli P-Kiviõli P-Kiviõli P-Kiviõli
Aidu Aidu Aidu Aidu
Estonia Estonia Estonia Estonia
Kohtla-Vanaküla Kohtla-Vanaküla
Narva
Narva Narva Narva
Tammiku
Tammiku
Tammiku
Tammiku
Uus Kiviõli
Uus Kiviõli
Uus Kiviõli
Viru Viru
Ojamaa
Ojamaa Ojamaa
Seli
Seli
0
5
10
15
20
25
2010 2015 2020 2025
Aastad
Kaevise kogus, Mt/a
Seli
Ojamaa
Viru
Uus Kiviõli
Tammiku
Narva
Kohtla-Vanaküla
Estonia
Aidu
P-Kiviõli
Ubja
Joonis 4 Kaevandamismahtude prognoos aastani 2025
Potentsiaalsed väljad on kõik põlevkivi uuringuväljad. Piirangute tõttu võib käesolevas uuringus
piirduda kaeveväljadega, kuhu on esitatud kaevandamisloa taotlused, kuna need on reaalseimad
kaevandamiskohad aastani 2025.
Aastatel 2006 kuni 2025 kaevandatavad alad asuvad praeguste kaevandamiskohtade läheduses
(Joonis 5).
Kiviõli
Estonia
Ahtme
Kaevandus 2
Käva 2
Kaevandus 4
Kohtla
Sompa
Viru
Tammiku
Küttejõu
Puhatu
Permisküla
Oandu
Uus Kiviõli
Ojamaa
Kabala
Tudu
Kohala Uljaste Põhja-Kiviõli
Sonda
Peipsi
Seli
Pada
Pada
Estonia
Estonia
Slantsõ2
Aidu
Narva
Kohtla-Järve
Vana Kohtla
Joonis 5 Mustad alad on aastatel 2006-2025 kaevandatavad alad arvestades nõutavat kaevandamismahtu
Aastaks 2025 on kaevandamine lõpetatud Narva karjääri põhja-jaoskondades, Tammiku-Kose ja
Kohtla-Vanaküla karjäärides. Kaevandamine jätkub kaeveväljade lõuna- ja läänealadel.
1.4. Kaevandamise mõju põhjavee tasemele
Mäetöödega alaneb veetase Keila-Kukruse veekihis, mistõttu raskeneb selle kasutamine vee
tarbimiseks. Modelleerimise tulemusel on võimalik hinnata, millised Keila-Kukruse veekihi
7
kaevud jäävad uute kaevealade2
mõjupiirkonda ja kasutada seda teavet kohaliku veevarustuse
rekonstrueerimisel. [9].
Modelleerimise eesmärgiks on näidata põhjaveetasemeid Keila-Kukruse veekihi kohta ja
alanduslehtrit uute kaevanduste rajamisel ja seniste kaevanduste mäetööde arenedes. Mudeli
koostamisel on arvestatud, et põhjavee tase töötavates kaevandustes püsib põlevkivikihindi põhja
tasemel. Suletud kaevandustes on veetase taastunud endise, enne pumpamise ja mäetööde
alustamist oleva tasemeni. Veetase mäetöödega rikkumata alal on määratud seireandmetega..
Veetaset enne uute kaevanduste rajamist iseloomustab mudeli üheks väljundiks olev läbilõige (Joonis
6) aastal 2005 oleva veetasemega. Lõige I-I’ algab maardla lääneosa Kohala uuringuplokist ulatudes
Viru kaevanduseni.
Kunda jõgi
SOMPA
KAEVANDUS
AIDU
KARJÄÄR
Savala jõeorg
KIVIÕLI
KAEVANDUS
KOHTLA KAEVANDUS
VIRU
KAEVANDUS
Joonis 6 Lõike I-I’ asukoht ja Keila-Kukruse põhjaveekihi veetasemejooned 2005.a Lõige I-I’: KeilaKukruse
põhjavee tase aastal 2005
Lõige läbib geoloogilise ehituse poolest erinevaid alasid – jõeorge, kõrgendikke, suletud kaevandusi ja
töötavate kaevanduste ala. Lõige aitab hinnata vaadeldava veetaseme loodusliku nivoo kõrgust nii
mäetöödega puutumata alal kui tööstuse rajamisel tekkinud tasememuutust.
Analoogselt aitab põhjaveealandust visualiseerida 3D mudel (Joonis 7). Põhjaveetase on alandatud
põlevkivikihindini Aidu karjääri ja Viru kaevanduse alanduslehtri piirkonnas. Veetaseme tõus nende
2
kaevealade all mõistetakse siin uusi rajatavaid kaevandus- või karjäärialasid ning töötavate kaevanduste laiendusi.
8
vahelisel alal näitab taastunud veetaseme seisu suletud Kohtla ja Sompa kaevandustes,
absoluutkõrgusega 40…41.5 m. Taastunud veetase on näha ka suletud Kiviõli kaevanduse alal
41…42 m kõrgusel.
Joonis 7 Keila-Kukruse veekihi staatiline mudel. Töötavate kaevealade piirkonnas on näha veetaseme
alanemist.
Aidu karjääri veetase on alandatud kuni põlvkivikihindini, mis ulatub 27…35 m merepinnast. Tänane
veetase tulevase Uus-Kiviõli kaeveväljal on absoluutkõrgusega 45 m. Kaevandamise käigus
alandatakse veetase põlevkivikihindi põhjani või sellest allapoole, kujunedes kõrguseni 10…20 m.
Veetaseme alandamine maapinna lähedal sõltub vaadeldava ala geoloogilisest ehitusest ja
suhtelistest veepidemetest. Oandu veepideme tõttu on sademete mõju Keila-Kukruse veekihile
väiksemate mõjutustega ja veetaseme alandamine teistes, maapinna lähedal olevates veekihtides on
väiksem. Alanduslehtri raadius uue Uus-Kiviõli kaevanduse rajamisel jääb sarnaselt Sompa
kaevandusele 1…2 km piiresse.[12]
Alanduslehtri raadiuse arvutamisel on kasutatud analoogia meetodit, eeldades geoloogiliselt
sarnaste tingimuste olemasolu, kus eeldatakse filtratsioonimooduli suuruse ja katendikivimite
vähest muutust. Arvestades katendi paksust on arvutuste tulemustel leitud, et alanduslehter
ulatub ligikaudu 2…5 km kaugusele mäetööde piirist. Mida paksem on katend, seda suurem on
Keila-Kukruse põhjaveekihi alanduslehtri raadius. (Tabel 3)
Veetaseme muutusi aastaks 2025 näitab kaart põhjaveetaseme samakõrgusjoontega. (Joonis 8)
9
Joonis 8 Keila-Kukruse veetaseme seisundi prognoos Eesti põlevkivimaardlas aastal 2025.
Rajatud on Ojamaa, Seli, Sompa ja Uus-Kiviõli kaeveväljad.
Koostatud veetasemete kaart ja alanduslehtri raadiuse hinnang on prognoos, kuid konkreetsema ja
täpsustud situatsiooni näitamiseks vastaval kaeveväljal tuleb koostada täpsustatud hinnang, mis
lahendatakse projektipõhiselt. Täpsustatud hinnangu koostamisel on oluline arvestada antud piirkonna
veejuhtivusi, rikete vööndeid ja geoloogiliste kihtide omadusi.
Tabel 3 Alanduslehtri raadius, km
Kaeveväli Keskmine
katendipaksus, m
Alanduslehtri ligikaudne
raadius, km
Ojamaa 38 1…2
Seli 68 3,5...4
Sompa 30 1…2
Uus-Kiviõli 35 0,5…2
Narva 17 1…2
Estonia 57 3…5
Aidu 22



Ingo Valgma: Maa-aluse maailma saladused
Maa-aluse maailma saladused
GIS päev
Ingo Valgma Mis toimub meie jalge all?
• Tunnetatav
• Mittetunnetatav
• Müstiline
13.11.2007 GIS päev 2
Tunnetatav
• Salvkaev aias
• Kanalisatsioonikaev linnas
• Tunnel kaljus
• Koobas Toril
13.11.2007 GIS päev 3
Tunnel
13.11.2007 GIS päev 4
Müstiline
• Põrgu
• Plutoonia (meie maakera sees on
veel teine maakera)
• Käik mis ühendab Kukruse mõisa
Jõhvi kirikuga
• Käik mis viib Pirita kloostrist
Toompea alla
13.11.2007 GIS päev 5
Mittetunnetatav
• Kanalisatsioonitorustik
• Metroo
• Kaevandus
• Koobastik
• Vulkaanilõõr
• Lõhe maa sees või mere all
13.11.2007 GIS päev 6
mi.ttu.ee
Maaalune, allmaa, maasisene
• Kanalisatsioonikaev, luuk peal,
bussijaam kaubanduskeskuse all
• Kaevandus
• Tori põrgu (koobas liivakivis)
13.11.2007 GIS päev 7
mi.ttu.ee
Kaevandus ja karjäär
• Koobastik – looduslik, st. üldjuhul
mitte inimese poolt rajatud
tühimikud maa all
• Kaevandus = allmaakaevandus
• Karjäär = pealmaakaevandus
13.11.2007 GIS päev 8
mi.ttu.ee
Kaeveõõned karjääris
• Kraav, kaevik, tranšee
• Kaevetranšee
• Veotranšee
• Auk
13.11.2007 GIS päev 9
mi.ttu.ee 10
Kaevetranšee vaalkarjääris
Narva karjäär
mi.ttu.ee 11
mi.ttu.ee
Suur auk-karjäär
13.11.2007 GIS päev 12
mi.ttu.ee
Väike auk-karjäär
13.11.2007 GIS päev 13
mi.ttu.ee
Kaevandus
• Maavara
• Kaeveõõned
– Šaht ≠ kaevandus
– Kamber
– Stoll
– Šurf
– Strekk
• Tervik
13.11.2007 GIS päev 14
mi.ttu.ee
Strekk
13.11.2007 GIS päev 15
mi.ttu.ee 16
Estonia kaevanduse kambrid ja
tervikud
mi.ttu.ee
Pargipink kambris
13.11.2007 GIS päev 17
mi.ttu.ee 13.11.2007 18
Kombainkaevandamine Eestis
mi.ttu.ee
Saladus
• Mittenähtav
• Mittetunnetatav
• Mittetajutav
• Tundmatu
• Kardina tagune
13.11.2007 GIS päev 19
mi.ttu.ee
Mis auk see on?
13.11.2007 GIS päev 20
mi.ttu.ee
Mis urgas see on?
13.11.2007 GIS päev 21
mi.ttu.ee
Mis kraav see on?
13.11.2007 GIS päev 22
mi.ttu.ee
Kuhu see kraav välja viib?
13.11.2007 GIS päev 23
mi.ttu.ee
Mis käik see on?
13.11.2007 GIS päev 24
mi.ttu.ee
Miks raudtee kõver on?
mi.ttu.ee
Mis juhtus?
mi.ttu.ee
Kas Piusa koobas on ohtlik?
13.11.2007 GIS päev 27
mi.ttu.ee
Miks see auk keset metsa on?
13.11.2007 GIS päev 28
mi.ttu.ee
Kuidas on GIS seotud maaaluse
maailmaga?
• GIS e. ruumiline
modelleerimine on ainus
võimalus arusaadavalt
kirjeldada maa-alust
maailma
13.11.2007 GIS päev 29
mi.ttu.ee 13.11.2007 30
Oil plant
Closed plant
Power plant
Closed power plant
Narva
Narva-
Jõesuu
Eesti
Power Plant
Slantsõ
Lake Peipsi
Gulf of Narva
Jõhvi
Sillamäe
Ahtme
Power Plant
Kohtla-
Kiviõli Järve
Kohtla-
Nõmme
Püssi
Surface mined area
Underground mine
Permissions are
not resoluted
New mine
© Enno Reinsalu, 2007
Flooded mine
Reservation
Rakvere
Kunda
Mezhduretshije
Põhja-Kiviõli
Kirovskoje
Ubja
Haljala
Kirovi
Leningradskaja
nr 4
Vanamõisa
Kiviõli
Estonia
Ahtme
nr 2
Käva
Sompa
Kukruse
Viru
Puhatu
Permisküla
Oandu
Uus Kiviõli
Ojamaa
Kabala
Tudu
Kohala Uljaste
Rakvere
Sonda
Peipsi
Seli
Pada
1
Narva
Aidu
Usnova
Nr 3
Kohtla
Tammiku
Sirgala-Viivikonna
6
Põlevkivimaardla
mi.ttu.ee 31
RUSSIA
ESTONIA
OIL SHALE BEDDING DEPTH, meters
UNDERGROUND OIL SHALE MINING FIELDS
CALORIFIC YIELD, SHOWS ACTIVE DEPOSIT
OIL SHALE RESEARCH FIELDS
MINED OUT AREAS
OIL SHALE OPEN CAST FIELDS
35 GJ/m2
25
Kirov skaja
IDA VIRU COUNTY
Sirgala
open cast
Narv a
open cast
Permisküla
GULF O F FINLAND
Ahtme
Peipsi
Puhatu
35 GJ/m2
25 GJ/m2
Seli
Viru
Estonia
Kohtla
Ojamaa
Underground oil shale
mining area,
abandoned mines Aidu
open cast
Uus Kiv iõli
Oandu
Kiv iõli
Puhatu
30
80
70
55
60
45
65
50
40
40
35
15
20
25
30
80
35
20
15
25
10
10
mi.ttu.ee 13.11.2007 GIS päev 32
mi.ttu.ee
Läbilõige
13.11.2007 GIS päev 33
mi.ttu.ee 13.11.2007 GIS päev 34
Lõiked, kivimi omadused
mi.ttu.ee
Kas Jõhvi vangla upub?
13.11.2007 GIS päev 35
mi.ttu.ee 13.11.2007 36
Mis on Jõhvi kõrgendiku sees?
mi.ttu.ee 13.11.2007 37
Kuidas kaevandada 1 km sügavusel
lasuvat rauamaaki?
mi.ttu.ee 13.11.2007 38
Kuidas tasanda
karjääripuistanguid?
mi.ttu.ee
Kuidas vasemaak (või graniit
Maardust) maa seest kätte saada?
13.11.2007 GIS päev 39
mi.ttu.ee
Kas vedada maa all kopplaaduri
või konveieriga?
13.11.2007 GIS päev 40
mi.ttu.ee 13.11.2007 41
Kuidas allmaakaevandamine
mõjutab elu rabas?
mi.ttu.ee
Kas Kohtla kaevandusest saab
põlevkivi Aidu karjääri viia?
13.11.2007 GIS päev 42
mi.ttu.ee
Kuhu rajatakse uued
kaevandused?
13.11.2007 GIS päev 43
Kiviõli
Estonia
Ahtme
Kaevandus 2
Käva 2
Kaevandus 4
Kohtla
Sompa
Viru
Tammiku
Küttejõu
Puhatu
Permisküla
Oandu
Uus Kiviõli
Haljala
Ojamaa
Kabala
Tudu
Kohala Uljaste
Rakvere
Põhja-Kiviõli
Sonda
Peipsi
Seli
Pada
Pada
Estonia
Estonia
Slantsõ2
Slantsõ1
Aidu
Narva
Kohtla-Järve
Vana Kohtla
mi.ttu.ee
3D Tarkvara
• FLAC
• MINEX / SURPAC, Vulcan
• Vertical Mapper, Surfer, Discover
• Modflow, Plaxis
• Autocad, Microstation
• jne
13.11.2007 GIS päev 44
mi.ttu.ee
Kivimite püsivus
13.11.2007 GIS päev 45
mi.ttu.ee 46
Model Generation: Mine Layout – Horizontal map
Results
mi.ttu.ee 47
FLAC3D 3.00
TU Bergakademie Freiberg
Professur Bergbau/Tiefbau
Step 3980 Model Perspective
16:55:40 Sun Jun 25 2006
Center:
X: 7.450e+001
Y: 6.824e+001
Z: 4.914e+001
Rotation:
X: 10.000
Y: 0.000
Z: 0.000
Dist: 4.568e+002 Mag.: 1
Ang.: 22.500
Job Title: Horst - Peterstollen
View Title:
Block Group
gips mm1
anhydrit unteres sulfat mm2
mergelkalkstein mo1
mergelstein mo2
Axes
Fixed
Linestyle
X
Y
Z
Model Generation: Stratigraphic Sequence
Results
mi.ttu.ee 48
Model Generation: Transfer into the Model
FLAC3D 3.00
TU Bergakademie Freiberg
Professur Bergbau/Tiefbau
Step 3980 Model Perspective
17:17:29 Sun Jun 25 2006
Center:
X: 7.450e+001
Y: 6.350e+001
Z: 5.050e+001
Rotation:
X: 90.000
Y: 0.000
Z: 0.000
Dist: 3.120e+002 Mag.: 1
Ang.: 22.500
Job Title: Horst - Peterstollen
View Title:
Block Group
gips mm1
Axes
Fixed
Linestyle
X
Y
Z
Results
mi.ttu.ee 49
Modellerzeugung: Block Definition
FLAC3D 3.00
TU Bergakademie Freiberg
Professur Bergbau/Tiefbau
Settings: Model Perspective
09:35:37 Thu Jun 22 2006
Center:
X: 7.450e+001
Y: 6.350e+001
Z: 5.370e+000
Rotation:
X: 90.000
Y: 0.000
Z: 0.000
Dist: 3.474e+002 Mag.: 1
Ang.: 22.500
Job Title: Ralingen
View Title:
Block Group
feste1.7
feste1.8
feste1.9
feste2.1
feste2.2
feste2.3
feste2.9
gips mm1
b1
b2
b3
b4
b5
b6
b7
b8
b9
b10
b11
b12
X
Y
Z
Results
mi.ttu.ee 50
FLAC3D 3.00
TU Bergakademie Freiberg
Professur Bergbau/Tiefbau
Settings: Model Perspective
14:07:54 Thu Jun 22 2006
Center:
X: 7.450e+001
Y: 6.350e+001
Z: 5.370e+000
Rotation:
X: 90.000
Y: 0.000
Z: 0.000
Dist: 3.474e+002 Mag.: 1
Ang.: 22.500
Job Title: Ralingen
View Title:
Block Group
b80
b81
b82
b83
b84
b85
b86
b87
b88
b89
b91
b92
b93
b94
b95
b96
b97
b98
b99
b100
X
Y
Z
Model Generation: Room and pillar => open stoping
Results
mi.ttu.ee 51
FLAC3D 3.00
TU Bergakademie Freiberg
Professur Bergbau/Tiefbau
Step 3980 Model Perspective
17:43:01 Sun Jun 25 2006
Center:
X: 1.179e+002
Y: 7.121e+001
Z: 9.760e+000
Rotation:
X: 2.598
Y: 358.906
Z: 90.550
Dist: 7.658e+002 Mag.: 18
Ang.: 22.500
Block Group
gips mm1
b1
a1
a2
a3
a4
a5
a6
feste4.1
feste4.2
feste4.3
feste4.4
feste4.5
feste4.6
feste4.7
feste4.8
feste4.9
feste4.10
feste4.11
Y
X
Z
Results
Model Generation: Room and pillar => open stoping
mi.ttu.ee 52
Model Generation - Animation
FLAC3D 3.00
TU Bergakademie Freiberg
Professur Bergbau/Tiefbau
Step 3980 Model Perspective
11:26:11 Wed Jul 05 2006
Center:
X: 8.747e+001
Y: 5.562e+001
Z: 2.901e+001
Rotation:
X: 24.310
Y: 0.000
Z: 64.660
Dist: 2.697e+002 Mag.: 4.29
Ang.: 22.500
Job Title: R0
View Title:
Contour of SMin
Magfac = 1.000e+000
Gradient Calculation
-1.4264e+001 to -1.4000e+001
-1.4000e+001 to -1.3000e+001
-1.3000e+001 to -1.2000e+001
-1.2000e+001 to -1.1000e+001
-1.1000e+001 to -1.0000e+001
-1.0000e+001 to -9.0000e+000
-9.0000e+000 to -8.0000e+000
-8.0000e+000 to -7.0000e+000
-7.0000e+000 to -6.0000e+000
-6.0000e+000 to -5.0000e+000
-5.0000e+000 to -4.0000e+000
-4.0000e+000 to -3.0000e+000
-3.0000e+000 to -2.0000e+000
-2.0000e+000 to -1.0000e+000
-1.0000e+000 to -5.3629e-001
Interval = 1.0e+000
Axes
X
Y
Z
Results
mi.ttu.ee 53
FLAC3D 3.00
TU Bergakademie Freiberg
Professur Bergbau/Tiefbau
Step 4350 Model Perspective
11:26:22 Wed Jul 05 2006
Center:
X: 8.747e+001
Y: 5.562e+001
Z: 2.901e+001
Rotation:
X: 24.310
Y: 0.000
Z: 64.660
Dist: 2.697e+002 Mag.: 4.29
Ang.: 22.500
Job Title: R1
View Title:
Contour of SMin
Magfac = 1.000e+000
Gradient Calculation
-1.4259e+001 to -1.4000e+001
-1.4000e+001 to -1.3000e+001
-1.3000e+001 to -1.2000e+001
-1.2000e+001 to -1.1000e+001
-1.1000e+001 to -1.0000e+001
-1.0000e+001 to -9.0000e+000
-9.0000e+000 to -8.0000e+000
-8.0000e+000 to -7.0000e+000
-7.0000e+000 to -6.0000e+000
-6.0000e+000 to -5.0000e+000
-5.0000e+000 to -4.0000e+000
-4.0000e+000 to -3.0000e+000
-3.0000e+000 to -2.0000e+000
-2.0000e+000 to -1.0000e+000
-1.0000e+000 to -3.3848e-002
Interval = 1.0e+000
Axes
X
Y
Z
Results
Model Generation - Animation
mi.ttu.ee 54
FLAC3D 3.00
TU Bergakademie Freiberg
Professur Bergbau/Tiefbau
Step 4799 Model Perspective
11:26:40 Wed Jul 05 2006
Center:
X: 8.747e+001
Y: 5.562e+001
Z: 2.901e+001
Rotation:
X: 24.310
Y: 0.000
Z: 64.660
Dist: 2.697e+002 Mag.: 4.29
Ang.: 22.500
Job Title: R2
View Title:
Contour of SMin
Magfac = 1.000e+000
Gradient Calculation
-1.4228e+001 to -1.4000e+001
-1.4000e+001 to -1.3000e+001
-1.3000e+001 to -1.2000e+001
-1.2000e+001 to -1.1000e+001
-1.1000e+001 to -1.0000e+001
-1.0000e+001 to -9.0000e+000
-9.0000e+000 to -8.0000e+000
-8.0000e+000 to -7.0000e+000
-7.0000e+000 to -6.0000e+000
-6.0000e+000 to -5.0000e+000
-5.0000e+000 to -4.0000e+000
-4.0000e+000 to -3.0000e+000
-3.0000e+000 to -2.0000e+000
-2.0000e+000 to -1.0000e+000
-1.0000e+000 to -5.3657e-001
Interval = 1.0e+000
Axes
X
Y
Z
Results
Model Generation - Animation
mi.ttu.ee 55
FLAC3D 3.00
TU Bergakademie Freiberg
Professur Bergbau/Tiefbau
Step 5150 Model Perspective
11:26:49 Wed Jul 05 2006
Center:
X: 8.747e+001
Y: 5.562e+001
Z: 2.901e+001
Rotation:
X: 24.310
Y: 0.000
Z: 64.660
Dist: 2.697e+002 Mag.: 4.29
Ang.: 22.500
Job Title: R3
View Title:
Contour of SMin
Magfac = 1.000e+000
Gradient Calculation
-1.4203e+001 to -1.4000e+001
-1.4000e+001 to -1.3000e+001
-1.3000e+001 to -1.2000e+001
-1.2000e+001 to -1.1000e+001
-1.1000e+001 to -1.0000e+001
-1.0000e+001 to -9.0000e+000
-9.0000e+000 to -8.0000e+000
-8.0000e+000 to -7.0000e+000
-7.0000e+000 to -6.0000e+000
-6.0000e+000 to -5.0000e+000
-5.0000e+000 to -4.0000e+000
-4.0000e+000 to -3.0000e+000
-3.0000e+000 to -2.0000e+000
-2.0000e+000 to -1.0000e+000
-1.0000e+000 to -2.2474e-001
Interval = 1.0e+000
Axes
X
Y
Z
Results
Model Generation - Animation
mi.ttu.ee 56
FLAC3D 3.00
TU Bergakademie Freiberg
Professur Bergbau/Tiefbau
Step 5581 Model Perspective
11:26:57 Wed Jul 05 2006
Center:
X: 8.747e+001
Y: 5.562e+001
Z: 2.901e+001
Rotation:
X: 24.310
Y: 0.000
Z: 64.660
Dist: 2.697e+002 Mag.: 4.29
Ang.: 22.500
Job Title: R4
View Title:
Contour of SMin
Magfac = 1.000e+000
Gradient Calculation
-1.4184e+001 to -1.4000e+001
-1.4000e+001 to -1.3000e+001
-1.3000e+001 to -1.2000e+001
-1.2000e+001 to -1.1000e+001
-1.1000e+001 to -1.0000e+001
-1.0000e+001 to -9.0000e+000
-9.0000e+000 to -8.0000e+000
-8.0000e+000 to -7.0000e+000
-7.0000e+000 to -6.0000e+000
-6.0000e+000 to -5.0000e+000
-5.0000e+000 to -4.0000e+000
-4.0000e+000 to -3.0000e+000
-3.0000e+000 to -2.0000e+000
-2.0000e+000 to -1.0000e+000
-1.0000e+000 to -5.3751e-001
Interval = 1.0e+000
Axes
X
Y
Z
Results
Model Generation - Animation
mi.ttu.ee 57
FLAC3D 3.00
TU Bergakademie Freiberg
Professur Bergbau/Tiefbau
Step 5908 Model Perspective
11:27:05 Wed Jul 05 2006
Center:
X: 8.747e+001
Y: 5.562e+001
Z: 2.901e+001
Rotation:
X: 24.310
Y: 0.000
Z: 64.660
Dist: 2.697e+002 Mag.: 4.29
Ang.: 22.500
Job Title: R5
View Title:
Contour of SMin
Magfac = 1.000e+000
Gradient Calculation
-1.4174e+001 to -1.4000e+001
-1.4000e+001 to -1.3000e+001
-1.3000e+001 to -1.2000e+001
-1.2000e+001 to -1.1000e+001
-1.1000e+001 to -1.0000e+001
-1.0000e+001 to -9.0000e+000
-9.0000e+000 to -8.0000e+000
-8.0000e+000 to -7.0000e+000
-7.0000e+000 to -6.0000e+000
-6.0000e+000 to -5.0000e+000
-5.0000e+000 to -4.0000e+000
-4.0000e+000 to -3.0000e+000
-3.0000e+000 to -2.0000e+000
-2.0000e+000 to -1.0000e+000
-1.0000e+000 to -2.2811e-001
Interval = 1.0e+000
Axes
X
Y
Z
Results
Model Generation - Animation
mi.ttu.ee 58
FLAC3D 3.00
TU Bergakademie Freiberg
Professur Bergbau/Tiefbau
Step 6338 Model Perspective
11:27:13 Wed Jul 05 2006
Center:
X: 8.747e+001
Y: 5.562e+001
Z: 2.901e+001
Rotation:
X: 24.310
Y: 0.000
Z: 64.660
Dist: 2.697e+002 Mag.: 4.29
Ang.: 22.500
Job Title: R6
View Title:
Contour of SMin
Magfac = 1.000e+000
Gradient Calculation
-1.4167e+001 to -1.4000e+001
-1.4000e+001 to -1.3000e+001
-1.3000e+001 to -1.2000e+001
-1.2000e+001 to -1.1000e+001
-1.1000e+001 to -1.0000e+001
-1.0000e+001 to -9.0000e+000
-9.0000e+000 to -8.0000e+000
-8.0000e+000 to -7.0000e+000
-7.0000e+000 to -6.0000e+000
-6.0000e+000 to -5.0000e+000
-5.0000e+000 to -4.0000e+000
-4.0000e+000 to -3.0000e+000
-3.0000e+000 to -2.0000e+000
-2.0000e+000 to -1.0000e+000
-1.0000e+000 to -5.4064e-001
Interval = 1.0e+000
Axes
X
Y
Z
Results
Model Generation - Animation
mi.ttu.ee 59
FLAC3D 3.00
TU Bergakademie Freiberg
Professur Bergbau/Tiefbau
Step 6641 Model Perspective
11:27:25 Wed Jul 05 2006
Center:
X: 8.747e+001
Y: 5.562e+001
Z: 2.901e+001
Rotation:
X: 24.310
Y: 0.000
Z: 64.660
Dist: 2.697e+002 Mag.: 4.29
Ang.: 22.500
Job Title: R7
View Title:
Contour of SMin
Magfac = 1.000e+000
Gradient Calculation
-1.4164e+001 to -1.4000e+001
-1.4000e+001 to -1.3000e+001
-1.3000e+001 to -1.2000e+001
-1.2000e+001 to -1.1000e+001
-1.1000e+001 to -1.0000e+001
-1.0000e+001 to -9.0000e+000
-9.0000e+000 to -8.0000e+000
-8.0000e+000 to -7.0000e+000
-7.0000e+000 to -6.0000e+000
-6.0000e+000 to -5.0000e+000
-5.0000e+000 to -4.0000e+000
-4.0000e+000 to -3.0000e+000
-3.0000e+000 to -2.0000e+000
-2.0000e+000 to -1.0000e+000
-1.0000e+000 to -2.2819e-001
Interval = 1.0e+000
Axes
X
Y
Z
Results
Model Generation - Animation
mi.ttu.ee
Põleng, vajumine
13.11.2007 GIS päev 60
mi.ttu.ee
mi.ttu.ee
SPONTANEUS COMBUSTION
mi.ttu.ee
MINING SUBSIDENCE CH4
Tree
Tree
House Building 2
Factory
Tree Tree
REHABILITATION OF
MINE WASTE DUMP
CH4
ROCK BURST
Prof. JAN PALARSKI
mi.ttu.ee
METHANE DRAINAGE UND UTILIZATION
Prof. JAN PALARSKI
mi.ttu.ee
Sandstone
Shale
Void
Mixture
Pipeline
FILLING OF WEBER VOID
mi.ttu.ee
Abb. 2.22-2
Finite Element – Method (simulation possibility)
Pic.16; 2007-11-10
mi.ttu.ee
Mine Subsidence
Pic.24; 2007 – 11 10
Subsidence
B
B
A
O-Line Subsidence A
0
Standard figures:
Depth
Thickness
Subsidence
850 m
200 cm
in cm
Pic. 7; 2007-11-10
Maa-alune saladus?
13.11.2007
Paper: Technogenic water in closed mines
Paper: Technogenic water in closed mines  Oil Shale, 2006, Vol. 23, No. 1 ISSN 0208-189X pp. 15–28 © 2006 Estonian Academy Publishers The present paper is based on the results of the research conducted in 2004 by the Department of Mining of the Tallinn University of Technology and Estonian Oil Shale Company. The state of the technogenic water body that has formed in the central part of the oil shale deposit is analysed: the water level in the area of the stopped and closed mines, water amount and move- ment direction, water quality and its changes. The state of the water is assessed and predicted using modelling of the water tables, statistical analysis of the water quality parameters and the pilot model for describing the migration of water. The results show that the technogenic water body studied is in a relatively stable state, and the quality of the groundwater in that area is fast improving approaching the drinking water standards. Introduction The Estonia oil shale deposit comprises about ten closed and stopped deep mines that are fully or partly filled with water (Table 1). Eight mines in the central part of the deposit: Ahtme, Kohtla, Kukruse, Käva, Sompa, Tammiku and mines Nos. 2 and 4 form one water body. After Ahtme mine was filled with water in December 2004 (Fig. 1), the water body turned relatively stable. Ubja mine and joint Kiviõli and Küttejõu mine are located in the western part of the deposit, farther away from the other mines. In addi- tion to oil shale mines, Sillamäe uranium mine (1949–1952) [1], and Ülgase (1922–1938) and Maardu phosphorite mines (1942–1965) have been closed in Estonia. The water regime in these mines has not been studied yet and is not discussed in the present paper. * Table 1. Closed and flooded underground oil shale mines Mine Closed – (pumps were stopped) Mined area, km2 * Water table a.s.l., m Outflow regulating the water table Approximate water volume, 106 m3 Central part of the deposit: Kukruse 1967 13 51–54 Mostly into Käva and Jõhvi mines 3.5–6** Käva and Käva-2 1973 18 51–52 From an old adit into Vahtsepa ditch 9–11** Mine No. 2 (Jõhvi mine) 1974 13 51–56 Mostly into Tammiku mine, during flood to Jõhvi city 10–11** Mine No. 4 1975 13 41–42 Mostly into neigh bouring mines 3–8** Tammiku December 1999 40 44–48 Into the Kose River and Viru mine 34 Sompa February 2000 27 40–45 Into neighbouring mines 23 Kohtla June 2001 17 39–42 Into Aidu opencast 13 Ahtme December 2001 – December 2002 35 ≈ 47 From drill holes and springs into Sanniku brook 36 Separate mines in the western part of the deposit Kiviõli & Küttejõu 1989 29 41 ± 0.5 From a ditch into the Purtse River Up to 29 Ubja 1960 2 ≈ 55 From an adit into the Toolse River Not determined Total ≈ 170 * [5] ** Depending on the water level [6] As a rule, the mine workings and groundwater cone of depression formed during mining fill with water after the cease of mine pumping. The degree of filling depends on the mining depth and the height of outflow. The tunnels of Ahtme, Sompa and Tammiku mines are completely, those of mines Nos. 2 and 4 almost completely water-filled. The rest of the mines (Kiviõli, Kukruse and Käva) contain areas with dry floor. The museum founded in Kohtla mine is dry because of to the draining effect of Aidu opencast and the water barriers surrounding the exposition area. The water level changes depending Technogenic Water in Closed Oil Shale Mines 17 10 15 20 25 30 35 40 45 50 2002 2003 2004 2005 Water level, m Tarakuse well Pagari well Fig. 1. Increase in the water table in closed Ahtme mine on the amount of precipitation and water exchange with neighbouring mines. The rate and amplitude of the changes differ from mine to mine. Several problems have arisen from the flooding of the closed mines. First, the technogenic water body started to affect the amount of the water pumped out of the working mines and its seasonal variation [2]. Clearly, the water of the closed mines will influence also the new mines, planned to be constructed in the Ojamaa and Uus-Kiviõli mine fields. Second, the environ- ment is affected by the water that in several places has risen to the pre- mining level (of the year 1945) and by the new springs formed. Several projects have been undertaken to fight the flooding, and it has turned out that no sufficient source data for mine planning are available. Third, the water of the closed mines is an easily accessible water resource, thus it is important to know and predict its quality [3]. Prediction of the mine water quality is essential also because of the fact that groundwater elevation in the mine field has started to affect the water supply of the region – the water richer in sulphates runs into the outdated and leaky common wells. It has also been prognosticated that if the groundwater table rises higher than 45–47 m, the water in the Ahtme mine field will affect the water level and quality of the Vasavere intake [4]. Fourth, the land above old mines has subsided and the rocks are fractured, therefore the technogenic groundwater is weakly protected and the contribution of precipitation to groundwater formation is very high. Water level The present study is based on the water level measurement data (incl. archive data) provided by the Estonian Oil Shale Company, Geological Fig. 2. Map of the technogenic water body Technogenic Water in Closed Oil Shale Mines 19 Survey of Estonia and Municipality of the town of Jõhvi. The water levels of the Keila–Kukruse, Lasnamäe–Kunda and Nabala–Rakvere aquifers, closed mines and main outlets were measured on an average period of 20 years. New data were obtained in the years 2003 and 2004. Field works and monitoring started in the spring of 2004 and are still going on. An essential part of the research was the modelling of the level of the Keila–Kukruse aquifer in the stationary regime. The modelling area included the central part of the deposit – underground mines and Aidu opencast. Data from about 50 observation wells were used. The water level of working mines was described at the level of the oil shale bed floor. Closed mines were treated as independent water sub-bodies, where the water level is constant at a certain moment of time (Table 1). The MapInfo Professional software was used, combined with the modelling package Vertical Mapper. The comparison and calibration of the intermediate results obtained and discussions held showed that the best interpolation method was triangulation with smoothing, because in that case interpolation takes place only between data points or observation wells, without modelling the situation outside the study area. During the first stage of the research the state of the water body in August 2004 was assessed. According to the measurements and calculations performed, precipitation accounts for up to 70% of the water pumped out of mines [2]. The autumn–winter season of 2004 was rich in precipitation, with little snow and relatively warm. Therefore it could be expected that Ahtme mine would fill with water sooner than predicted [4]. To check that hypothesis, the model was calibrated at the second stage of the research in December 2004. The contour map of the modelled water table is shown in Fig. 2. By continuous improvement of the existing and addition of new data more than ten two- and three-dimensional map versions were completed. The model enabled us to assess the water levels in different mines and their border areas and to make assumptions and predictions about the water move- ment directions. Water quality In the years 2000–2004 the department of environmental services of the Estonian Oil Shale Company had the waters of all closed mines analysed. The samples were taken at six sites in four mines in different seasons. Analyses were made at the central laboratory of the Estonian Oil Shale Company (3 analyses), in Tartu Environmental Research Ltd. (2 analyses) and in the Geological Survey of Estonia (12 analyses). Up to 16 quality parameters were determined. The results of the analyses are presented in Table 2. The quality parameters are arranged in Table 2 in the decreasing order of the variation in measurement results. At first glance only the average contents of iron, sulphates and phenols obtained for the observation period do not meet the drinking water standards. This cannot be a final conclusion. The average Table 2. Water quality parameters in closed Ahtme, Kohtla, Sompa and Tammiku mines Quality parameter Unit Number of measurement results Numerical data for the entire period (2000–2004) Leachates Total Certain numerical values Arithmetical mean Standard deviation Variation coefficient Max. levels permitted in drinking water Total Fe mg/l 14 10* 0.69 1.16 1.67 <0.2 NO3 - mg/l 15 11* 11.7 18.55 1.58 <50 NO2 - mg/l 12 7* 0.015 0.0166 1.10 <0.5 SO4 2- mg/l 15 15 342.4 240.2 0.70 <250 Dry residue mg/l 14 14 845.5 569.6 0.67 – Mg2+ mg/l 15 15 51.6 32.58 0.63 – K+ mg/l 13 13 12.9 8.11 0.63 – Ca2+ mg/l 15 15 174.5 107.6 0.62 – Na+ mg/l 14 14 10.4 6.33 0.61 <200 Cl mg/l 15 15 16.4 9.74 0.59 <250 Total hardness mge/l 13 13 13.72 7.04 0.51 – Oil products mg/l 15 4* 0.15 0.073 0.49 <0.05 Conductivity μS/cm 14 14 1095 477.6 0.44 <2500 NH4 + mg/l 12 2* 0.017 0.0064 0.39 <0.5 Total phenols mg/l 15 4** 0.0017 0.00049 0.28 <0.0005 pH 15 15 7.1 0.33 0.05 6.5–9.5 * due to the lack of a certain numerical value the result was smaller than the preciseness of the laboratory tests, but not exceeding the limits permitted in drinking water ** due to the lack of a certain numerical value the result was smaller than the preciseness of the laboratory tests, in two cases not exceeding the limits permitted in drinking water; rest of the samples gave no unique result Notes: Quality parameters are ordered according to the variation coefficient. The shaded lines contain the measurement results the average of which does not meet the Estonian drinking water standard. The content of benzo(a)pyrene was measured in 11 samples. The results are not included in the table because no certain numerical values were obtained. In all samples the benzo(a) pyrene content was lower than the permitted maximum value. and standard deviations given in the table have been calculated for all closed mines and for the entire observation period, thus they characterize only the data set and not the quality of water or a particular mine. Variation in the measurement results is caused by influential as well as random factors. Influential factors are the sampling site (mine) and the time span that has passed since the closure of the mine. Let us treat this assumption as a working hypothesis. A random factor is the season when sampling was performed. For example, in the years 2000 and 2001 samples were taken in summer, in 2002– 2004 in autumn. Surely the water quality parameters depend also on the Technogenic Water in Closed Oil Shale Mines 21 location of the sampling site in the mine field. Some part of variations result from the methodology of sampling and laboratory tests. The reliability of iron content analyses carried out in different laboratories could be questioned. The phenol content of mine water, measured repeatedly during mining, has been 0.003 ± 0.001 mg/l, except for Kiviõli mine, which has been strongly affected by chemical industry. Here the phenol content of mine water was 0.38 mg/l [7]. For preliminary checking of the working hypothesis we conducted a two- factor (place and time) variation analysis of the sulphate and iron contents of Tammiku and Sompa mine waters. The results of sulphate analysis are given in Table 3. We can see that the hypothesis of the influence of place and time on the sulphate content of water is relatively strong (probability of a counter- hypothesis 18.0 and 18.8% respectively). The residual standard deviation (187 mg/l), however, is too large for making definite conclusions. Obviously the result is influenced by taking samples in different seasons. An analogous result was obtained by the variation analysis of the iron content, whereas the impact of time turned out to be small. Possibly this could result from the treatment of samples in different laboratories. In spite of great uncertainty of measurement, the sulphate and iron contents decrease with time. This trend is depicted by graphs in Fig. 3. As could be expected, the purification of water is best described by the exponential function. The constants in the formulae (801 and 0.77 mg/l, respectively) characterize the average concentrations at the initial moment of the dilution process (at the closure of mines) and the time factors (–0.386 and –0.507, respectively) show the rate of water purification. The half-life of the concentration calculated on the basis of time factors, i.e. the time period during which the content of a component decrease twice, is about 1.8 years for sulphates and 1.4 years for iron. From the half-life and graphs we may presume that in about five years after the closure of a mine the content of sulphates and iron decreases below the maximum permitted level in drinking water. The highest permitted content of iron in first-class drinking water is 0.2 m/l and that of sulphates 250 m/l. The data on all mines are included in the graphs of Fig. 3. The measure- ments revealed varying initial concentrations of sulphates for different mines. The highest concentration was recorded in the first sample from Ahtme mine, the lowest in Kohtla mine. Actually, this is not the initial level, since the first samples were taken 4–11 months after the pumps had been stopped. Approximating the results obtained from the samples of each mine separately, we get theoretical dilution of the initial concentration level at the zero moment, about 2200 mg/l for Ahtme and 300 mg/l for Sompa. These values refer to a relation between the depth of the mine and the initial concentration of sulphates. The hydrogeological background of this pheno- menon is discussed by Erg [3]. Table 3. Results of the variation analysis of the content of sulphates Source of Variation df MS F P-value Mines (Tammiku, Sompa) 1 91681 2.63 0.180 Years (2002–2004) 4 92788 2.66 0.183 Error 4 34924 Residual Standard Deviation 187 mg/l Total 9 SO4 2- = 801 e-0.386 t, mg/l R2 = 0.46 10 100 1000 10000 01234567 t - closed, years SO42- - sulphate content, mg/l 250 mg/l Fe = 0.77 e -0.509 t , mg/l R2 = 0.39 0.01 0.1 1 10 01234567 t - closed, years Fe content, mg/l 0.2 mg/l Fig. 3. Decrease in the content of SO4 2- and Fe in closed mines. 250 mg/l and 0.2 mg/l – maximum permitted levels in drinking water. The water quality parameters for which we had at least 14 reliable measurement results (pH, electric conductivity, total hardness, Cl- , dry Technogenic Water in Closed Oil Shale Mines 23 residue, Na+ , Ca2+, Mg2+, K+ and SO4 2- ) were subjected to correlation analysis. From the analysis we could conclude the following: • The content of sulphates can be considered a good indicator of mine water quality, because it correlates well with most of the other water quality parameters, except for K+ . • Electric conductivity can be successfully used for rapid assessment of water quality, because it correlates well with sulphates as well as with other main parameters (except for K+ ). • pH is not informative enough, because it does not correlate with any other water quality parameter. Pilot model of water exchange Continuous water exchange is going on between the closed mines. The water penetrating into mines is derived mostly from precipitation, less from groundwater. The part of the water not flowing out of the mine (Table 1) infiltrates into the neighbouring mines or feeds aquifers. The water pumped out of the working mines is formed of precipitation, groundwater and the water coming from closed mines. Intensity of water exchange depends on the length (L, km) and thickness (l, m) of the barrier left between the mines, difference between the water levels of neighbouring mines (dh, m) and permeability of the barrier and overburden (km, m2 /d). The longer and thinner is the barrier, the greater is the water level difference in neighbouring water bodies, and the higher is the permeability of rocks in the areas separating the mines, the more intensive is the exchange of water. The water levels of the closed mines are precisely known. The measure- ments of barriers can be obtained from the plan of mining works, but the length and thickness of the barriers are highly variable. Little data are available on the permeability of pillars and bedrock. As seen in Table 4, the permeability of the Keila–Kukruse aquifer differs up to 10 times within the limits of the deposit. Water permeability is largely affected by the geological disturbance of the Earth crust (mostly karst zones), which makes the aquifer highly aniso- tropic [8, 9]. In the Estonia mine field twofold difference in the permeability in the northeastern and southeastern directions has been recorded. According to the data by Domanova, anisotropy is especially great in the area of tectonic dislocations, where permeability in various directions may differ several times. Water exchange between the mines is inhibited by extensive karst zones running along the mine field boundaries between Sompa and Viru, and Ahtme and Tammiku mines. At the same time, karst zones running transversely to the mine boundary increase the water exchange between Sompa and Kohtla mines. Additionally, the water exchange is affected by the properties of the mined area, which depend on the roof handling methods used. In the area Table 4. Permeability of the Keila–Kukruse groundwater aquifer in the mining district Filtration module Publication District Permeability, m2 /d Estimated difference in water tables, m m/h m/d Kohtla – Aidu, northern part 1200 5 10 240 Kohtla – Aidu, central part 780 10 3.25 78 [8] Kohtla 6–60 Viru 10–40 [7] Aidu, generalized 393 10 1.6 39 Ahtme, generalized 335 10 1.4 34 [4] Tammiku 4–20 Ahtme 1–15 [7] Ahtme – Estonia 90 10 0.38 9 [4] No. 2 – Tammiku 0.24 6 [10] mined using roof caving the water-bearing horizon is thicker and of higher permeability than in the area of room-and-pillar mining. Because of high uncertainty the calculation of the water amounts moving between the closed mines is complicated, not only due to the variability in L, l, k, but also due to the lack of the relation uniquely describing all the situations. Therefore the present study makes use of the balance method, which unites the amounts of the water pumped out of the working mines, and of precipitation and groundwater infiltrating into the mine. The relation between these amounts is expressed by the approximate formula qij = 365.25 × Lij × kij × (dhij/2) / (1000 × lij), where qij – the amount of the water migrating from one mine (i) to the other (j), million m3 /y, Lij – length of the barrier between these mines, km, lij – average thickness of the barrier, m, dhji – difference between the water levels of two closed mines at the moment of modelling, m, kij – factor characterizing the permeability of the area between the mines (barriers and overlying rock), which, with some reservation, can be considered as generalized permeability, m2 /d. As model input we use the measurements of the barriers between the mines, volume of the water pumped out of the working mines (especially changes in it due to the closure of neighbouring mines), amount of precipita- tion and its relation to mine pumping [2]. The variable parameter of the Technogenic Water in Closed Oil Shale Mines 25 model is generalized permeability, which is used to balance the model. Permeability was fitted into the model taking into consideration the informa- tion available (Table 4), location of mines with respect to tectonic fault zones and the orientation of the karst zones lying between the mines. The balanced model can be used for calculating the migrating water amounts by fluctuations in water level, for example during floods and heavy rains, but also for planning water level regulations. The model output is the matrix of water exchange (Table 5), where • “North” denotes the northern closed mines No. 2, Kukruse, and Käva and its satellite mines • “West” denotes the western closed mines Kohtla, Sompa and No. 4 • “Vasavere” is the area east of Ahtme and Estonia mines • The water amounts in the matrix of water exchange are given in million m3 /y, whereas (+) shows the amounts infiltrating into the mine (i) from the mine (j) and (–) shows the amounts migrating from the mine (i) to the other mine. Explanations to the matrix of water exchange are given in Table 6. Water movement inside the water body and the amounts of mine pumping are shown in Fig. 1. The values presented characterize the state of the water body in the year 2004, but as we have to do with a pilot model, these are all approximate. Table 5. Matrix of water exchange, year 2004, 106 m3 /y ↓Elements of the water body → Aidu Estonia Viru Ahtme Tammiku North West Vasavere Jõhvi city Sum Working mines: Aidu 0.00 0.00 0.00 0.00 0.00 0.00 14.46 0.00 0.00 14.46 Estonia 0.00 0.00 1.64 6.48 0.00 0.00 0.00 0.48 0.00 8.60 0.00 0.00 –1.64 0.00 0.18 7.23 0.00 3.07 0.00 0.00 8.83 Technogenic water body; closed mines (sub-bodies): Ahtme 0.00 –6.48 –0.18 0.00 0.07 0.00 0.00 –1.07 0.00 –7.65 Tammiku 0.00 0.00 –7.23 –0.07 0.00 2.28 –1.69 –0.50 0.00 –7.22 North 0.00 0.00 0.00 0.00 –2.28 0.00 –4.60 0.00 –0.15 –7.03 West – 14.46 0.00 –3.07 0.00 1.69 4.60 0.00 0.00 0.00 –11.24 Geographical sites: Vasavere 0.00 –0.48 0.00 1.07 0.50 0.00 0.00 0.00 0.00 1.09 Town of Jõhvi 0.00 0.00 0.00 0.00 0.00 0.15 0.00 0.00 0.00 0.15 Table 6. Water exchange between mines Mines, techno- genic water sub-bodies and geographical sites Water exchange, 106 m3 /y Comments Working mines: Aidu 14.46 Inflow from closed Kohtla mine Estonia 8.60 Main inflow from closed Ahtme mine, less from the direction of working Viru mine, partly also from the east Viru 8.83 Inflow from closed Tammiku and Sompa mines, slight outflow into Estonia mine Technogenic water body; closed mines (sub-bodies): Ahtme –7.65 Outflow mainly into Estonia mine and into the catchment area of the Pühajõgi River through springs and outflow wells Tammiku –7.22 Intensive water exchange with other parts of the water body, out flow into the catchment area of the Pühajõgi River through a caving at Kose Northern closed mines Käva, Kukruse and No. 2 –7.03 Feeds other closed mines, outflow via Vahtsepa ditch into the Kohtla River Western closed mines Kohtla, Sompa and Mine No 4. –11.24 Intensive water exchange with other parts of the water body, feeds mostly Aidu opencast Geographical sites: Vasavere 1.09 Water inflow mostly from Ahtme mine, to some extent also from closed Tammiku mine Town of Jõhvi 0.15 Water infiltrates from closed mine No. 2 Conclusions and recommendations No great changes in the water level of closed mines and its seasonal variation are expected if no measures are taken. The situation should not change after the closure of presently working mines either. In future the water level of flooded Aidu opencast will be regulated by an outlet into the Ojamaa River at 40–42 m level, which will be also the common water level in Kohtla and Sompa mines. In the area of Viru and Estonia mines the groundwater will rise to the pre-mining level, which will result in an increase in groundwater flow into the Pühajõgi River at the eastern margin of Tammiku and Ahtme mines. It may turn necessary to regulate water level in the mining district. In order to reduce the flow of groundwater from mine No. 2 to the lower, area of the town of Jõhvi, the following options could be considered: • outlet of water at 51 m level at the northern boundary of the mine, near the adit of unbuilt mine No. 1 Technogenic Water in Closed Oil Shale Mines 27 • blasting of the barrier between mine No. 2 and Käva and Tammiku mines to enable water outflow towards the Kohtla River (at a level of 51 m) or into the Pühajõgi River (at 45–47 m level) • building of a pumping station regulating the water level and operating seasonally, but this is evidently not efficient due to great expenses. In order to reduce the water amounts penetrating into working mines and towards Vasavere intake, it would be purposeful to lower the water level in several closed mines: • to 45 m level in Tammiku mine, by dredging the present outlet • to 42–43 m level in Ahtme mine, by drilling artesian wells The quality of the water of closed mines is improving. The content of sulphates and iron in mine water decreases and in about five years after the closure of the mine is below the maximum level permitted in drinking water. Monitoring the water quality in closed mines should be aimed mostly at protecting the water body from surface-derived pollution. The sampling methods should be improved, with indicating justified times and places for taking water samples. In some cases the number of parameters measured could be reduced. As no reliable data are available about the formation and distribution of phenols in the water of closed mines, corresponding investigations are needed before the use of the water. Although phenols are generally believed to originate from the waste of shale oil plants or from burning spoil dumps, the possibility of their formation during decomposition of kerogen in water- filled mines cannot be excluded either. This hypothesis deserves further special study. Acknowledgements This paper was written within the framework of Grant 5913 of the Estonian Science Foundation “Usage of mined-out areas”, using the database of research No. 416L “Forecast of hydrogeological changes resulting from the activities of the Estonian Oil Shale Mining Company” carried out by Tallinn University of Technology. REFERENCES 1. Reinsalu, E. Sillamäe uranium mine // Environment Technics. 2001. No. 2. P. 40–45 [in Estonian]. 2. Reinsalu, E. Changes in mine dewatering after the closure of exhausted oil shale mines // Oil Shale. 2005. Vol. 22, No. 3. P. 261–273. 3. Erg, K. Changes in groundwater sulphate content in Estonian oil shale mining area // Oil Shale. 2005. Vol. 22, No. 3. P. 275–289. 28 E. Reinsalu, I. Valgma, H. Lind, K. Sokman 4. Savitski, L., Savva, V. Prognosis of hydrogeological changes in the mining district of the Estonian oil shale deposit, stages 1–3, 2001 [in Estonian] 5. Reinsalu, E., Toomik, A., Valgma, I. Mined out land, Tallinn, 2002 [in Estonian]. 6. Butakova, A., Jürgenfeldt, G., Reinsalu, E. Assessment of the mine water volume of water-filled oil shale mines // Gorjutšie slancy. 1980. No. 1. P. 6 [in Russian]. 7. Parahonski, E. Formation of mine water in oil shale mines and opencasts and mine drainage. Tallinn, Valgus, 1983 [in Russian]. 8. Domanova, N., Reinsalu, E. Analysis of hydrogeological conditions in Oktoobri opencast, Topic 0107, Stage HD No. 1, Estonian Branch of A. Skotchinski Institute of Mining Engineering, 1979 [in Russian]. 9. Domanova, N. Formation and forecast of water flowing into the mine workings driven into carbonate rocks with uneven infiltration properties. Candidate’s thesis, A. Skotchinski Institute of Mining Engineering, 1986 [in Russian]. 10. Domanova, N. Predicted increase in the water inflow into Viru mine due to the flooding of Tammiku mine. Estonian Oil Shale Company, Jõhvi, 1999. Manu- script [in Russian]. Recieved June 20, 2005
Oil Shale, 2006, Vol. 23, No. 1 ISSN 0208-189X pp. 15–28 © 2006 Estonian Academy Publishers The present paper is based on the results of the research conducted in 2004 by the Department of Mining of the Tallinn University of Technology and Estonian Oil Shale Company. The state of the technogenic water body that has formed in the central part of the oil shale deposit is analysed: the water level in the area of the stopped and closed mines, water amount and move- ment direction, water quality and its changes. The state of the water is assessed and predicted using modelling of the water tables, statistical analysis of the water quality parameters and the pilot model for describing the migration of water. The results show that the technogenic water body studied is in a relatively stable state, and the quality of the groundwater in that area is fast improving approaching the drinking water standards. Introduction The Estonia oil shale deposit comprises about ten closed and stopped deep mines that are fully or partly filled with water (Table 1). Eight mines in the central part of the deposit: Ahtme, Kohtla, Kukruse, Käva, Sompa, Tammiku and mines Nos. 2 and 4 form one water body. After Ahtme mine was filled with water in December 2004 (Fig. 1), the water body turned relatively stable. Ubja mine and joint Kiviõli and Küttejõu mine are located in the western part of the deposit, farther away from the other mines. In addi- tion to oil shale mines, Sillamäe uranium mine (1949–1952) [1], and Ülgase (1922–1938) and Maardu phosphorite mines (1942–1965) have been closed in Estonia. The water regime in these mines has not been studied yet and is not discussed in the present paper. * Table 1. Closed and flooded underground oil shale mines Mine Closed – (pumps were stopped) Mined area, km2 * Water table a.s.l., m Outflow regulating the water table Approximate water volume, 106 m3 Central part of the deposit: Kukruse 1967 13 51–54 Mostly into Käva and Jõhvi mines 3.5–6** Käva and Käva-2 1973 18 51–52 From an old adit into Vahtsepa ditch 9–11** Mine No. 2 (Jõhvi mine) 1974 13 51–56 Mostly into Tammiku mine, during flood to Jõhvi city 10–11** Mine No. 4 1975 13 41–42 Mostly into neigh bouring mines 3–8** Tammiku December 1999 40 44–48 Into the Kose River and Viru mine 34 Sompa February 2000 27 40–45 Into neighbouring mines 23 Kohtla June 2001 17 39–42 Into Aidu opencast 13 Ahtme December 2001 – December 2002 35 ≈ 47 From drill holes and springs into Sanniku brook 36 Separate mines in the western part of the deposit Kiviõli & Küttejõu 1989 29 41 ± 0.5 From a ditch into the Purtse River Up to 29 Ubja 1960 2 ≈ 55 From an adit into the Toolse River Not determined Total ≈ 170 * [5] ** Depending on the water level [6] As a rule, the mine workings and groundwater cone of depression formed during mining fill with water after the cease of mine pumping. The degree of filling depends on the mining depth and the height of outflow. The tunnels of Ahtme, Sompa and Tammiku mines are completely, those of mines Nos. 2 and 4 almost completely water-filled. The rest of the mines (Kiviõli, Kukruse and Käva) contain areas with dry floor. The museum founded in Kohtla mine is dry because of to the draining effect of Aidu opencast and the water barriers surrounding the exposition area. The water level changes depending Technogenic Water in Closed Oil Shale Mines 17 10 15 20 25 30 35 40 45 50 2002 2003 2004 2005 Water level, m Tarakuse well Pagari well Fig. 1. Increase in the water table in closed Ahtme mine on the amount of precipitation and water exchange with neighbouring mines. The rate and amplitude of the changes differ from mine to mine. Several problems have arisen from the flooding of the closed mines. First, the technogenic water body started to affect the amount of the water pumped out of the working mines and its seasonal variation [2]. Clearly, the water of the closed mines will influence also the new mines, planned to be constructed in the Ojamaa and Uus-Kiviõli mine fields. Second, the environ- ment is affected by the water that in several places has risen to the pre- mining level (of the year 1945) and by the new springs formed. Several projects have been undertaken to fight the flooding, and it has turned out that no sufficient source data for mine planning are available. Third, the water of the closed mines is an easily accessible water resource, thus it is important to know and predict its quality [3]. Prediction of the mine water quality is essential also because of the fact that groundwater elevation in the mine field has started to affect the water supply of the region – the water richer in sulphates runs into the outdated and leaky common wells. It has also been prognosticated that if the groundwater table rises higher than 45–47 m, the water in the Ahtme mine field will affect the water level and quality of the Vasavere intake [4]. Fourth, the land above old mines has subsided and the rocks are fractured, therefore the technogenic groundwater is weakly protected and the contribution of precipitation to groundwater formation is very high. Water level The present study is based on the water level measurement data (incl. archive data) provided by the Estonian Oil Shale Company, Geological Fig. 2. Map of the technogenic water body Technogenic Water in Closed Oil Shale Mines 19 Survey of Estonia and Municipality of the town of Jõhvi. The water levels of the Keila–Kukruse, Lasnamäe–Kunda and Nabala–Rakvere aquifers, closed mines and main outlets were measured on an average period of 20 years. New data were obtained in the years 2003 and 2004. Field works and monitoring started in the spring of 2004 and are still going on. An essential part of the research was the modelling of the level of the Keila–Kukruse aquifer in the stationary regime. The modelling area included the central part of the deposit – underground mines and Aidu opencast. Data from about 50 observation wells were used. The water level of working mines was described at the level of the oil shale bed floor. Closed mines were treated as independent water sub-bodies, where the water level is constant at a certain moment of time (Table 1). The MapInfo Professional software was used, combined with the modelling package Vertical Mapper. The comparison and calibration of the intermediate results obtained and discussions held showed that the best interpolation method was triangulation with smoothing, because in that case interpolation takes place only between data points or observation wells, without modelling the situation outside the study area. During the first stage of the research the state of the water body in August 2004 was assessed. According to the measurements and calculations performed, precipitation accounts for up to 70% of the water pumped out of mines [2]. The autumn–winter season of 2004 was rich in precipitation, with little snow and relatively warm. Therefore it could be expected that Ahtme mine would fill with water sooner than predicted [4]. To check that hypothesis, the model was calibrated at the second stage of the research in December 2004. The contour map of the modelled water table is shown in Fig. 2. By continuous improvement of the existing and addition of new data more than ten two- and three-dimensional map versions were completed. The model enabled us to assess the water levels in different mines and their border areas and to make assumptions and predictions about the water move- ment directions. Water quality In the years 2000–2004 the department of environmental services of the Estonian Oil Shale Company had the waters of all closed mines analysed. The samples were taken at six sites in four mines in different seasons. Analyses were made at the central laboratory of the Estonian Oil Shale Company (3 analyses), in Tartu Environmental Research Ltd. (2 analyses) and in the Geological Survey of Estonia (12 analyses). Up to 16 quality parameters were determined. The results of the analyses are presented in Table 2. The quality parameters are arranged in Table 2 in the decreasing order of the variation in measurement results. At first glance only the average contents of iron, sulphates and phenols obtained for the observation period do not meet the drinking water standards. This cannot be a final conclusion. The average Table 2. Water quality parameters in closed Ahtme, Kohtla, Sompa and Tammiku mines Quality parameter Unit Number of measurement results Numerical data for the entire period (2000–2004) Leachates Total Certain numerical values Arithmetical mean Standard deviation Variation coefficient Max. levels permitted in drinking water Total Fe mg/l 14 10* 0.69 1.16 1.67 <0.2 NO3 - mg/l 15 11* 11.7 18.55 1.58 <50 NO2 - mg/l 12 7* 0.015 0.0166 1.10 <0.5 SO4 2- mg/l 15 15 342.4 240.2 0.70 <250 Dry residue mg/l 14 14 845.5 569.6 0.67 – Mg2+ mg/l 15 15 51.6 32.58 0.63 – K+ mg/l 13 13 12.9 8.11 0.63 – Ca2+ mg/l 15 15 174.5 107.6 0.62 – Na+ mg/l 14 14 10.4 6.33 0.61 <200 Cl mg/l 15 15 16.4 9.74 0.59 <250 Total hardness mge/l 13 13 13.72 7.04 0.51 – Oil products mg/l 15 4* 0.15 0.073 0.49 <0.05 Conductivity μS/cm 14 14 1095 477.6 0.44 <2500 NH4 + mg/l 12 2* 0.017 0.0064 0.39 <0.5 Total phenols mg/l 15 4** 0.0017 0.00049 0.28 <0.0005 pH 15 15 7.1 0.33 0.05 6.5–9.5 * due to the lack of a certain numerical value the result was smaller than the preciseness of the laboratory tests, but not exceeding the limits permitted in drinking water ** due to the lack of a certain numerical value the result was smaller than the preciseness of the laboratory tests, in two cases not exceeding the limits permitted in drinking water; rest of the samples gave no unique result Notes: Quality parameters are ordered according to the variation coefficient. The shaded lines contain the measurement results the average of which does not meet the Estonian drinking water standard. The content of benzo(a)pyrene was measured in 11 samples. The results are not included in the table because no certain numerical values were obtained. In all samples the benzo(a) pyrene content was lower than the permitted maximum value. and standard deviations given in the table have been calculated for all closed mines and for the entire observation period, thus they characterize only the data set and not the quality of water or a particular mine. Variation in the measurement results is caused by influential as well as random factors. Influential factors are the sampling site (mine) and the time span that has passed since the closure of the mine. Let us treat this assumption as a working hypothesis. A random factor is the season when sampling was performed. For example, in the years 2000 and 2001 samples were taken in summer, in 2002– 2004 in autumn. Surely the water quality parameters depend also on the Technogenic Water in Closed Oil Shale Mines 21 location of the sampling site in the mine field. Some part of variations result from the methodology of sampling and laboratory tests. The reliability of iron content analyses carried out in different laboratories could be questioned. The phenol content of mine water, measured repeatedly during mining, has been 0.003 ± 0.001 mg/l, except for Kiviõli mine, which has been strongly affected by chemical industry. Here the phenol content of mine water was 0.38 mg/l [7]. For preliminary checking of the working hypothesis we conducted a two- factor (place and time) variation analysis of the sulphate and iron contents of Tammiku and Sompa mine waters. The results of sulphate analysis are given in Table 3. We can see that the hypothesis of the influence of place and time on the sulphate content of water is relatively strong (probability of a counter- hypothesis 18.0 and 18.8% respectively). The residual standard deviation (187 mg/l), however, is too large for making definite conclusions. Obviously the result is influenced by taking samples in different seasons. An analogous result was obtained by the variation analysis of the iron content, whereas the impact of time turned out to be small. Possibly this could result from the treatment of samples in different laboratories. In spite of great uncertainty of measurement, the sulphate and iron contents decrease with time. This trend is depicted by graphs in Fig. 3. As could be expected, the purification of water is best described by the exponential function. The constants in the formulae (801 and 0.77 mg/l, respectively) characterize the average concentrations at the initial moment of the dilution process (at the closure of mines) and the time factors (–0.386 and –0.507, respectively) show the rate of water purification. The half-life of the concentration calculated on the basis of time factors, i.e. the time period during which the content of a component decrease twice, is about 1.8 years for sulphates and 1.4 years for iron. From the half-life and graphs we may presume that in about five years after the closure of a mine the content of sulphates and iron decreases below the maximum permitted level in drinking water. The highest permitted content of iron in first-class drinking water is 0.2 m/l and that of sulphates 250 m/l. The data on all mines are included in the graphs of Fig. 3. The measure- ments revealed varying initial concentrations of sulphates for different mines. The highest concentration was recorded in the first sample from Ahtme mine, the lowest in Kohtla mine. Actually, this is not the initial level, since the first samples were taken 4–11 months after the pumps had been stopped. Approximating the results obtained from the samples of each mine separately, we get theoretical dilution of the initial concentration level at the zero moment, about 2200 mg/l for Ahtme and 300 mg/l for Sompa. These values refer to a relation between the depth of the mine and the initial concentration of sulphates. The hydrogeological background of this pheno- menon is discussed by Erg [3]. Table 3. Results of the variation analysis of the content of sulphates Source of Variation df MS F P-value Mines (Tammiku, Sompa) 1 91681 2.63 0.180 Years (2002–2004) 4 92788 2.66 0.183 Error 4 34924 Residual Standard Deviation 187 mg/l Total 9 SO4 2- = 801 e-0.386 t, mg/l R2 = 0.46 10 100 1000 10000 01234567 t - closed, years SO42- - sulphate content, mg/l 250 mg/l Fe = 0.77 e -0.509 t , mg/l R2 = 0.39 0.01 0.1 1 10 01234567 t - closed, years Fe content, mg/l 0.2 mg/l Fig. 3. Decrease in the content of SO4 2- and Fe in closed mines. 250 mg/l and 0.2 mg/l – maximum permitted levels in drinking water. The water quality parameters for which we had at least 14 reliable measurement results (pH, electric conductivity, total hardness, Cl- , dry Technogenic Water in Closed Oil Shale Mines 23 residue, Na+ , Ca2+, Mg2+, K+ and SO4 2- ) were subjected to correlation analysis. From the analysis we could conclude the following: • The content of sulphates can be considered a good indicator of mine water quality, because it correlates well with most of the other water quality parameters, except for K+ . • Electric conductivity can be successfully used for rapid assessment of water quality, because it correlates well with sulphates as well as with other main parameters (except for K+ ). • pH is not informative enough, because it does not correlate with any other water quality parameter. Pilot model of water exchange Continuous water exchange is going on between the closed mines. The water penetrating into mines is derived mostly from precipitation, less from groundwater. The part of the water not flowing out of the mine (Table 1) infiltrates into the neighbouring mines or feeds aquifers. The water pumped out of the working mines is formed of precipitation, groundwater and the water coming from closed mines. Intensity of water exchange depends on the length (L, km) and thickness (l, m) of the barrier left between the mines, difference between the water levels of neighbouring mines (dh, m) and permeability of the barrier and overburden (km, m2 /d). The longer and thinner is the barrier, the greater is the water level difference in neighbouring water bodies, and the higher is the permeability of rocks in the areas separating the mines, the more intensive is the exchange of water. The water levels of the closed mines are precisely known. The measure- ments of barriers can be obtained from the plan of mining works, but the length and thickness of the barriers are highly variable. Little data are available on the permeability of pillars and bedrock. As seen in Table 4, the permeability of the Keila–Kukruse aquifer differs up to 10 times within the limits of the deposit. Water permeability is largely affected by the geological disturbance of the Earth crust (mostly karst zones), which makes the aquifer highly aniso- tropic [8, 9]. In the Estonia mine field twofold difference in the permeability in the northeastern and southeastern directions has been recorded. According to the data by Domanova, anisotropy is especially great in the area of tectonic dislocations, where permeability in various directions may differ several times. Water exchange between the mines is inhibited by extensive karst zones running along the mine field boundaries between Sompa and Viru, and Ahtme and Tammiku mines. At the same time, karst zones running transversely to the mine boundary increase the water exchange between Sompa and Kohtla mines. Additionally, the water exchange is affected by the properties of the mined area, which depend on the roof handling methods used. In the area Table 4. Permeability of the Keila–Kukruse groundwater aquifer in the mining district Filtration module Publication District Permeability, m2 /d Estimated difference in water tables, m m/h m/d Kohtla – Aidu, northern part 1200 5 10 240 Kohtla – Aidu, central part 780 10 3.25 78 [8] Kohtla 6–60 Viru 10–40 [7] Aidu, generalized 393 10 1.6 39 Ahtme, generalized 335 10 1.4 34 [4] Tammiku 4–20 Ahtme 1–15 [7] Ahtme – Estonia 90 10 0.38 9 [4] No. 2 – Tammiku 0.24 6 [10] mined using roof caving the water-bearing horizon is thicker and of higher permeability than in the area of room-and-pillar mining. Because of high uncertainty the calculation of the water amounts moving between the closed mines is complicated, not only due to the variability in L, l, k, but also due to the lack of the relation uniquely describing all the situations. Therefore the present study makes use of the balance method, which unites the amounts of the water pumped out of the working mines, and of precipitation and groundwater infiltrating into the mine. The relation between these amounts is expressed by the approximate formula qij = 365.25 × Lij × kij × (dhij/2) / (1000 × lij), where qij – the amount of the water migrating from one mine (i) to the other (j), million m3 /y, Lij – length of the barrier between these mines, km, lij – average thickness of the barrier, m, dhji – difference between the water levels of two closed mines at the moment of modelling, m, kij – factor characterizing the permeability of the area between the mines (barriers and overlying rock), which, with some reservation, can be considered as generalized permeability, m2 /d. As model input we use the measurements of the barriers between the mines, volume of the water pumped out of the working mines (especially changes in it due to the closure of neighbouring mines), amount of precipita- tion and its relation to mine pumping [2]. The variable parameter of the Technogenic Water in Closed Oil Shale Mines 25 model is generalized permeability, which is used to balance the model. Permeability was fitted into the model taking into consideration the informa- tion available (Table 4), location of mines with respect to tectonic fault zones and the orientation of the karst zones lying between the mines. The balanced model can be used for calculating the migrating water amounts by fluctuations in water level, for example during floods and heavy rains, but also for planning water level regulations. The model output is the matrix of water exchange (Table 5), where • “North” denotes the northern closed mines No. 2, Kukruse, and Käva and its satellite mines • “West” denotes the western closed mines Kohtla, Sompa and No. 4 • “Vasavere” is the area east of Ahtme and Estonia mines • The water amounts in the matrix of water exchange are given in million m3 /y, whereas (+) shows the amounts infiltrating into the mine (i) from the mine (j) and (–) shows the amounts migrating from the mine (i) to the other mine. Explanations to the matrix of water exchange are given in Table 6. Water movement inside the water body and the amounts of mine pumping are shown in Fig. 1. The values presented characterize the state of the water body in the year 2004, but as we have to do with a pilot model, these are all approximate. Table 5. Matrix of water exchange, year 2004, 106 m3 /y ↓Elements of the water body → Aidu Estonia Viru Ahtme Tammiku North West Vasavere Jõhvi city Sum Working mines: Aidu 0.00 0.00 0.00 0.00 0.00 0.00 14.46 0.00 0.00 14.46 Estonia 0.00 0.00 1.64 6.48 0.00 0.00 0.00 0.48 0.00 8.60 0.00 0.00 –1.64 0.00 0.18 7.23 0.00 3.07 0.00 0.00 8.83 Technogenic water body; closed mines (sub-bodies): Ahtme 0.00 –6.48 –0.18 0.00 0.07 0.00 0.00 –1.07 0.00 –7.65 Tammiku 0.00 0.00 –7.23 –0.07 0.00 2.28 –1.69 –0.50 0.00 –7.22 North 0.00 0.00 0.00 0.00 –2.28 0.00 –4.60 0.00 –0.15 –7.03 West – 14.46 0.00 –3.07 0.00 1.69 4.60 0.00 0.00 0.00 –11.24 Geographical sites: Vasavere 0.00 –0.48 0.00 1.07 0.50 0.00 0.00 0.00 0.00 1.09 Town of Jõhvi 0.00 0.00 0.00 0.00 0.00 0.15 0.00 0.00 0.00 0.15 Table 6. Water exchange between mines Mines, techno- genic water sub-bodies and geographical sites Water exchange, 106 m3 /y Comments Working mines: Aidu 14.46 Inflow from closed Kohtla mine Estonia 8.60 Main inflow from closed Ahtme mine, less from the direction of working Viru mine, partly also from the east Viru 8.83 Inflow from closed Tammiku and Sompa mines, slight outflow into Estonia mine Technogenic water body; closed mines (sub-bodies): Ahtme –7.65 Outflow mainly into Estonia mine and into the catchment area of the Pühajõgi River through springs and outflow wells Tammiku –7.22 Intensive water exchange with other parts of the water body, out flow into the catchment area of the Pühajõgi River through a caving at Kose Northern closed mines Käva, Kukruse and No. 2 –7.03 Feeds other closed mines, outflow via Vahtsepa ditch into the Kohtla River Western closed mines Kohtla, Sompa and Mine No 4. –11.24 Intensive water exchange with other parts of the water body, feeds mostly Aidu opencast Geographical sites: Vasavere 1.09 Water inflow mostly from Ahtme mine, to some extent also from closed Tammiku mine Town of Jõhvi 0.15 Water infiltrates from closed mine No. 2 Conclusions and recommendations No great changes in the water level of closed mines and its seasonal variation are expected if no measures are taken. The situation should not change after the closure of presently working mines either. In future the water level of flooded Aidu opencast will be regulated by an outlet into the Ojamaa River at 40–42 m level, which will be also the common water level in Kohtla and Sompa mines. In the area of Viru and Estonia mines the groundwater will rise to the pre-mining level, which will result in an increase in groundwater flow into the Pühajõgi River at the eastern margin of Tammiku and Ahtme mines. It may turn necessary to regulate water level in the mining district. In order to reduce the flow of groundwater from mine No. 2 to the lower, area of the town of Jõhvi, the following options could be considered: • outlet of water at 51 m level at the northern boundary of the mine, near the adit of unbuilt mine No. 1 Technogenic Water in Closed Oil Shale Mines 27 • blasting of the barrier between mine No. 2 and Käva and Tammiku mines to enable water outflow towards the Kohtla River (at a level of 51 m) or into the Pühajõgi River (at 45–47 m level) • building of a pumping station regulating the water level and operating seasonally, but this is evidently not efficient due to great expenses. In order to reduce the water amounts penetrating into working mines and towards Vasavere intake, it would be purposeful to lower the water level in several closed mines: • to 45 m level in Tammiku mine, by dredging the present outlet • to 42–43 m level in Ahtme mine, by drilling artesian wells The quality of the water of closed mines is improving. The content of sulphates and iron in mine water decreases and in about five years after the closure of the mine is below the maximum level permitted in drinking water. Monitoring the water quality in closed mines should be aimed mostly at protecting the water body from surface-derived pollution. The sampling methods should be improved, with indicating justified times and places for taking water samples. In some cases the number of parameters measured could be reduced. As no reliable data are available about the formation and distribution of phenols in the water of closed mines, corresponding investigations are needed before the use of the water. Although phenols are generally believed to originate from the waste of shale oil plants or from burning spoil dumps, the possibility of their formation during decomposition of kerogen in water- filled mines cannot be excluded either. This hypothesis deserves further special study. Acknowledgements This paper was written within the framework of Grant 5913 of the Estonian Science Foundation “Usage of mined-out areas”, using the database of research No. 416L “Forecast of hydrogeological changes resulting from the activities of the Estonian Oil Shale Mining Company” carried out by Tallinn University of Technology. REFERENCES 1. Reinsalu, E. Sillamäe uranium mine // Environment Technics. 2001. No. 2. P. 40–45 [in Estonian]. 2. Reinsalu, E. Changes in mine dewatering after the closure of exhausted oil shale mines // Oil Shale. 2005. Vol. 22, No. 3. P. 261–273. 3. Erg, K. Changes in groundwater sulphate content in Estonian oil shale mining area // Oil Shale. 2005. Vol. 22, No. 3. P. 275–289. 28 E. Reinsalu, I. Valgma, H. Lind, K. Sokman 4. Savitski, L., Savva, V. Prognosis of hydrogeological changes in the mining district of the Estonian oil shale deposit, stages 1–3, 2001 [in Estonian] 5. Reinsalu, E., Toomik, A., Valgma, I. Mined out land, Tallinn, 2002 [in Estonian]. 6. Butakova, A., Jürgenfeldt, G., Reinsalu, E. Assessment of the mine water volume of water-filled oil shale mines // Gorjutšie slancy. 1980. No. 1. P. 6 [in Russian]. 7. Parahonski, E. Formation of mine water in oil shale mines and opencasts and mine drainage. Tallinn, Valgus, 1983 [in Russian]. 8. Domanova, N., Reinsalu, E. Analysis of hydrogeological conditions in Oktoobri opencast, Topic 0107, Stage HD No. 1, Estonian Branch of A. Skotchinski Institute of Mining Engineering, 1979 [in Russian]. 9. Domanova, N. Formation and forecast of water flowing into the mine workings driven into carbonate rocks with uneven infiltration properties. Candidate’s thesis, A. Skotchinski Institute of Mining Engineering, 1986 [in Russian]. 10. Domanova, N. Predicted increase in the water inflow into Viru mine due to the flooding of Tammiku mine. Estonian Oil Shale Company, Jõhvi, 1999. Manu- script [in Russian]. Recieved June 20, 2005
Kaevandusala
Kaevandusala on vilets mõiste, kuna see võib selle kasutaja arvates viidata nii kaevandamise alale kui kaevanduse alale. Samas pole selge, mis asi on kaevandus - kas liivaauk või põlevkivikaevandus, või fosforiidikarjäär või turbaväli?
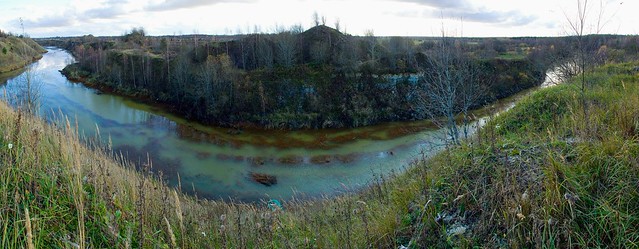


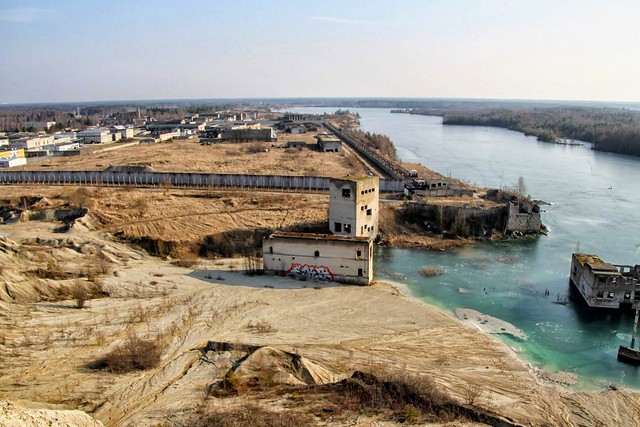


Vesi voolab karjäärist kaevandusse. Tegu on karjäärialaga aga ka kaevanduse alaga, sõltuvalt kontekstist:
Seetõttu on parem mõiste kaevandamise ala.
Fosforiidikaevandamise ala ehk täpsemalt fosforiidikarjäär ( mitte kaevandusala, kuna pildil ei ole ei kaevandust, ega kaevanduse ala ):
Turbakaevandamise ala ehk täpsemalt turbaväli või freesturbaväli või turbatootmisala ( mitte kaevandusala, kuna pildil ei ole ei kaevandust, ega kaevanduse ala ):
Seda ala võiks nimetada kaevanduse alaks, kuna tegu on fosforiidikaevanduse rikastusvabrikuga. Mäenduskeeles on see kaevanduse pealmaakompleks. Isegi siin on kaevandusala veidi nigel mõiste kuigi mööndusega võiks seda kasutada:
Lubjakivikaevandamise ala ehk täpsemalt lubjakivikarjäär mis oli kunagi kivimurd ( mitte kaevandusala, kuna pildil ei ole ei kaevandust, ega kaevanduse ala ):
Põlevkivikaevandamise ala ehk täpsemalt põlevkivikaevanduse peahoone varemed ( võib olla hädapärast kaevandusala, kuid parem on kaevandamise ala või kaevanduse ala ):
Laiemas mõistes kaevandamise ala ehk täpsemalt maagikarjääri metallurgiatehas ( mitte kaevandusala, kuna pildil ei ole ei kaevandust, ega kaevanduse ala ):
Põlevkivkaevandamise ala ehk täpsemalt kunagine põlevkivikarjäär ja põlevkivikaevandus, kus nüüd on näha õlitehas ( võib hädapärast nimetada kaevandusalaks, kuid parem on nimetada õlitehaseks või õlitööstuseks või kunagiseks kaevandamise alaks ):
Põlevkivikaevanduse peahoone varemed, mille fassaadile oli kirjutatud sõna "kaevandus" okupantide keeles. Seda võib hädapärast nimetada kaevandusalaks, aga parem on lihtsalt kaevandus või kaevanduse ala või kaevandamise ala. Siin on hoone kui sissepääs kaevandusse ehk allmaakaevõõntesse (allmaakäikudesse) ja hoone kui ettevõte, mis omab allmaakaeveõõsi.:
Lubjakivikaevandamise ala ehk täpsemalt lubjakivikarjäär ( mitte kaevandusala, kuna pildil ei ole ei kaevandust, ega kaevanduse ala ):
Paper: Technogenic water in closed mines
Paper: Technogenic water in closed mines
Oil Shale, 2006, Vol. 23, No. 1 ISSN 0208-189X
pp. 15–28 © 2006 Estonian Academy Publishers
The present paper is based on the results of the research conducted in 2004
by the Department of Mining of the Tallinn University of Technology and
Estonian Oil Shale Company. The state of the technogenic water body that
has formed in the central part of the oil shale deposit is analysed: the water
level in the area of the stopped and closed mines, water amount and move-
ment direction, water quality and its changes. The state of the water is
assessed and predicted using modelling of the water tables, statistical
analysis of the water quality parameters and the pilot model for describing
the migration of water. The results show that the technogenic water body
studied is in a relatively stable state, and the quality of the groundwater in
that area is fast improving approaching the drinking water standards.
Introduction
The Estonia oil shale deposit comprises about ten closed and stopped
deep mines that are fully or partly filled with water (Table 1). Eight mines in
the central part of the deposit: Ahtme, Kohtla, Kukruse, Käva, Sompa,
Tammiku and mines Nos. 2 and 4 form one water body. After Ahtme mine
was filled with water in December 2004 (Fig. 1), the water body turned
relatively stable. Ubja mine and joint Kiviõli and Küttejõu mine are located
in the western part of the deposit, farther away from the other mines. In addi-
tion to oil shale mines, Sillamäe uranium mine (1949–1952) [1], and Ülgase
(1922–1938) and Maardu phosphorite mines (1942–1965) have been closed
in Estonia. The water regime in these mines has not been studied yet and is
not discussed in the present paper.
*
Table 1. Closed and flooded underground oil shale mines
Mine
Closed –
(pumps
were
stopped)
Mined
area,
km2
*
Water table
a.s.l.,
m
Outflow regulating
the water table
Approximate
water volume,
106
m3
Central part of the deposit:
Kukruse 1967 13 51–54 Mostly into Käva and
Jõhvi mines
3.5–6**
Käva and
Käva-2
1973 18 51–52 From an old adit into
Vahtsepa ditch
9–11**
Mine No. 2
(Jõhvi mine)
1974 13 51–56 Mostly into Tammiku
mine, during flood
to Jõhvi city
10–11**
Mine No. 4 1975 13 41–42 Mostly into neigh bouring mines
3–8**
Tammiku December
1999
40 44–48 Into the Kose River
and Viru mine
34
Sompa February
2000
27 40–45 Into neighbouring
mines
23
Kohtla June
2001
17 39–42 Into Aidu opencast 13
Ahtme December
2001 –
December
2002
35 ≈ 47 From drill holes and
springs into Sanniku
brook
36
Separate mines in the western part of the deposit
Kiviõli &
Küttejõu
1989 29 41 ± 0.5 From a ditch into the
Purtse River
Up to 29
Ubja 1960 2 ≈ 55 From an adit into the
Toolse River
Not determined
Total ≈ 170
* [5]
** Depending on the water level [6]
As a rule, the mine workings and groundwater cone of depression formed
during mining fill with water after the cease of mine pumping. The degree of
filling depends on the mining depth and the height of outflow. The tunnels of
Ahtme, Sompa and Tammiku mines are completely, those of mines Nos. 2
and 4 almost completely water-filled. The rest of the mines (Kiviõli, Kukruse
and Käva) contain areas with dry floor. The museum founded in Kohtla mine
is dry because of to the draining effect of Aidu opencast and the water
barriers surrounding the exposition area. The water level changes depending
Technogenic Water in Closed Oil Shale Mines 17
10
15
20
25
30
35
40
45
50
2002 2003 2004 2005
Water level, m
Tarakuse well Pagari well
Fig. 1. Increase in the water table in closed Ahtme mine
on the amount of precipitation and water exchange with neighbouring mines.
The rate and amplitude of the changes differ from mine to mine.
Several problems have arisen from the flooding of the closed mines.
First, the technogenic water body started to affect the amount of the water
pumped out of the working mines and its seasonal variation [2]. Clearly, the
water of the closed mines will influence also the new mines, planned to be
constructed in the Ojamaa and Uus-Kiviõli mine fields. Second, the environ-
ment is affected by the water that in several places has risen to the pre-
mining level (of the year 1945) and by the new springs formed. Several
projects have been undertaken to fight the flooding, and it has turned out that
no sufficient source data for mine planning are available. Third, the water of
the closed mines is an easily accessible water resource, thus it is important to
know and predict its quality [3]. Prediction of the mine water quality is
essential also because of the fact that groundwater elevation in the mine field
has started to affect the water supply of the region – the water richer in
sulphates runs into the outdated and leaky common wells. It has also been
prognosticated that if the groundwater table rises higher than 45–47 m, the
water in the Ahtme mine field will affect the water level and quality of the
Vasavere intake [4]. Fourth, the land above old mines has subsided and the
rocks are fractured, therefore the technogenic groundwater is weakly protected
and the contribution of precipitation to groundwater formation is very high.
Water level
The present study is based on the water level measurement data (incl.
archive data) provided by the Estonian Oil Shale Company, Geological
Fig. 2. Map of the technogenic water body
Technogenic Water in Closed Oil Shale Mines 19
Survey of Estonia and Municipality of the town of Jõhvi. The water levels of
the Keila–Kukruse, Lasnamäe–Kunda and Nabala–Rakvere aquifers, closed
mines and main outlets were measured on an average period of 20 years.
New data were obtained in the years 2003 and 2004. Field works and
monitoring started in the spring of 2004 and are still going on.
An essential part of the research was the modelling of the level of the
Keila–Kukruse aquifer in the stationary regime. The modelling area included
the central part of the deposit – underground mines and Aidu opencast. Data
from about 50 observation wells were used. The water level of working mines
was described at the level of the oil shale bed floor. Closed mines were treated
as independent water sub-bodies, where the water level is constant at a certain
moment of time (Table 1). The MapInfo Professional software was used,
combined with the modelling package Vertical Mapper. The comparison and
calibration of the intermediate results obtained and discussions held showed
that the best interpolation method was triangulation with smoothing, because
in that case interpolation takes place only between data points or observation
wells, without modelling the situation outside the study area.
During the first stage of the research the state of the water body in August
2004 was assessed. According to the measurements and calculations performed,
precipitation accounts for up to 70% of the water pumped out of mines [2]. The
autumn–winter season of 2004 was rich in precipitation, with little snow and
relatively warm. Therefore it could be expected that Ahtme mine would fill with
water sooner than predicted [4]. To check that hypothesis, the model was
calibrated at the second stage of the research in December 2004. The contour
map of the modelled water table is shown in Fig. 2.
By continuous improvement of the existing and addition of new data
more than ten two- and three-dimensional map versions were completed.
The model enabled us to assess the water levels in different mines and their
border areas and to make assumptions and predictions about the water move-
ment directions.
Water quality
In the years 2000–2004 the department of environmental services of the
Estonian Oil Shale Company had the waters of all closed mines analysed. The
samples were taken at six sites in four mines in different seasons. Analyses
were made at the central laboratory of the Estonian Oil Shale Company
(3 analyses), in Tartu Environmental Research Ltd. (2 analyses) and in the
Geological Survey of Estonia (12 analyses). Up to 16 quality parameters were
determined. The results of the analyses are presented in Table 2.
The quality parameters are arranged in Table 2 in the decreasing order of
the variation in measurement results. At first glance only the average contents
of iron, sulphates and phenols obtained for the observation period do not meet
the drinking water standards. This cannot be a final conclusion. The average
Table 2. Water quality parameters in closed Ahtme, Kohtla,
Sompa and Tammiku mines
Quality
parameter Unit
Number of
measurement
results
Numerical data for the entire period
(2000–2004)
Leachates Total Certain
numerical
values
Arithmetical
mean
Standard
deviation
Variation
coefficient
Max. levels
permitted in
drinking
water
Total Fe mg/l 14 10* 0.69 1.16 1.67 <0.2
NO3
-
mg/l 15 11* 11.7 18.55 1.58 <50
NO2
-
mg/l 12 7* 0.015 0.0166 1.10 <0.5
SO4
2- mg/l 15 15 342.4 240.2 0.70 <250
Dry residue mg/l 14 14 845.5 569.6 0.67 –
Mg2+ mg/l 15 15 51.6 32.58 0.63 –
K+
mg/l 13 13 12.9 8.11 0.63 –
Ca2+ mg/l 15 15 174.5 107.6 0.62 –
Na+
mg/l 14 14 10.4 6.33 0.61 <200
Cl mg/l 15 15 16.4 9.74 0.59 <250
Total hardness mge/l 13 13 13.72 7.04 0.51 –
Oil products mg/l 15 4* 0.15 0.073 0.49 <0.05
Conductivity μS/cm 14 14 1095 477.6 0.44 <2500
NH4
+
mg/l 12 2* 0.017 0.0064 0.39 <0.5
Total phenols mg/l 15 4** 0.0017 0.00049 0.28 <0.0005
pH 15 15 7.1 0.33 0.05 6.5–9.5
* due to the lack of a certain numerical value the result was smaller than the preciseness of the
laboratory tests, but not exceeding the limits permitted in drinking water
** due to the lack of a certain numerical value the result was smaller than the preciseness of
the laboratory tests, in two cases not exceeding the limits permitted in drinking water; rest of
the samples gave no unique result
Notes:
Quality parameters are ordered according to the variation coefficient.
The shaded lines contain the measurement results the average of which does not meet the
Estonian drinking water standard.
The content of benzo(a)pyrene was measured in 11 samples. The results are not included in
the table because no certain numerical values were obtained. In all samples the benzo(a)
pyrene content was lower than the permitted maximum value.
and standard deviations given in the table have been calculated for all closed
mines and for the entire observation period, thus they characterize only the
data set and not the quality of water or a particular mine. Variation in the
measurement results is caused by influential as well as random factors.
Influential factors are the sampling site (mine) and the time span that has passed
since the closure of the mine. Let us treat this assumption as a working
hypothesis. A random factor is the season when sampling was performed. For
example, in the years 2000 and 2001 samples were taken in summer, in 2002–
2004 in autumn. Surely the water quality parameters depend also on the
Technogenic Water in Closed Oil Shale Mines 21
location of the sampling site in the mine field. Some part of variations result
from the methodology of sampling and laboratory tests. The reliability of
iron content analyses carried out in different laboratories could be questioned.
The phenol content of mine water, measured repeatedly during mining, has
been 0.003 ± 0.001 mg/l, except for Kiviõli mine, which has been strongly
affected by chemical industry. Here the phenol content of mine water was
0.38 mg/l [7].
For preliminary checking of the working hypothesis we conducted a two-
factor (place and time) variation analysis of the sulphate and iron contents of
Tammiku and Sompa mine waters. The results of sulphate analysis are given
in Table 3. We can see that the hypothesis of the influence of place and time
on the sulphate content of water is relatively strong (probability of a counter-
hypothesis 18.0 and 18.8% respectively). The residual standard deviation
(187 mg/l), however, is too large for making definite conclusions. Obviously
the result is influenced by taking samples in different seasons. An analogous
result was obtained by the variation analysis of the iron content, whereas the
impact of time turned out to be small. Possibly this could result from the
treatment of samples in different laboratories.
In spite of great uncertainty of measurement, the sulphate and iron
contents decrease with time. This trend is depicted by graphs in Fig. 3. As
could be expected, the purification of water is best described by the
exponential function. The constants in the formulae (801 and 0.77 mg/l,
respectively) characterize the average concentrations at the initial moment of
the dilution process (at the closure of mines) and the time factors (–0.386
and –0.507, respectively) show the rate of water purification. The half-life of
the concentration calculated on the basis of time factors, i.e. the time period
during which the content of a component decrease twice, is about 1.8 years
for sulphates and 1.4 years for iron. From the half-life and graphs we may
presume that in about five years after the closure of a mine the content of
sulphates and iron decreases below the maximum permitted level in drinking
water. The highest permitted content of iron in first-class drinking water is
0.2 m/l and that of sulphates 250 m/l.
The data on all mines are included in the graphs of Fig. 3. The measure-
ments revealed varying initial concentrations of sulphates for different
mines. The highest concentration was recorded in the first sample from
Ahtme mine, the lowest in Kohtla mine. Actually, this is not the initial level,
since the first samples were taken 4–11 months after the pumps had been
stopped. Approximating the results obtained from the samples of each mine
separately, we get theoretical dilution of the initial concentration level at the
zero moment, about 2200 mg/l for Ahtme and 300 mg/l for Sompa. These
values refer to a relation between the depth of the mine and the initial
concentration of sulphates. The hydrogeological background of this pheno-
menon is discussed by Erg [3].
Table 3. Results of the variation analysis of the content of sulphates
Source of Variation df MS F P-value
Mines (Tammiku, Sompa) 1 91681 2.63 0.180
Years (2002–2004) 4 92788 2.66 0.183
Error 4 34924
Residual Standard Deviation 187 mg/l
Total 9
SO4
2- = 801 e-0.386 t, mg/l
R2
= 0.46
10
100
1000
10000
01234567
t - closed, years
SO42- - sulphate content, mg/l
250 mg/l
Fe = 0.77 e -0.509 t , mg/l
R2
= 0.39
0.01
0.1
1
10
01234567
t - closed, years
Fe content, mg/l
0.2 mg/l
Fig. 3. Decrease in the content of SO4
2- and Fe in closed
mines.
250 mg/l and 0.2 mg/l – maximum permitted levels in
drinking water.
The water quality parameters for which we had at least 14 reliable
measurement results (pH, electric conductivity, total hardness, Cl-
, dry
Technogenic Water in Closed Oil Shale Mines 23
residue, Na+
, Ca2+, Mg2+, K+
and SO4
2- ) were subjected to correlation
analysis. From the analysis we could conclude the following:
• The content of sulphates can be considered a good indicator of mine
water quality, because it correlates well with most of the other water
quality parameters, except for K+
.
• Electric conductivity can be successfully used for rapid assessment of
water quality, because it correlates well with sulphates as well as with
other main parameters (except for K+
).
• pH is not informative enough, because it does not correlate with any
other water quality parameter.
Pilot model of water exchange
Continuous water exchange is going on between the closed mines. The
water penetrating into mines is derived mostly from precipitation, less from
groundwater. The part of the water not flowing out of the mine (Table 1)
infiltrates into the neighbouring mines or feeds aquifers. The water pumped
out of the working mines is formed of precipitation, groundwater and the
water coming from closed mines. Intensity of water exchange depends on
the length (L, km) and thickness (l, m) of the barrier left between the mines,
difference between the water levels of neighbouring mines (dh, m) and
permeability of the barrier and overburden (km, m2
/d). The longer and thinner
is the barrier, the greater is the water level difference in neighbouring water
bodies, and the higher is the permeability of rocks in the areas separating the
mines, the more intensive is the exchange of water.
The water levels of the closed mines are precisely known. The measure-
ments of barriers can be obtained from the plan of mining works, but the
length and thickness of the barriers are highly variable. Little data are
available on the permeability of pillars and bedrock. As seen in Table 4, the
permeability of the Keila–Kukruse aquifer differs up to 10 times within the
limits of the deposit.
Water permeability is largely affected by the geological disturbance of
the Earth crust (mostly karst zones), which makes the aquifer highly aniso-
tropic [8, 9]. In the Estonia mine field twofold difference in the permeability
in the northeastern and southeastern directions has been recorded. According
to the data by Domanova, anisotropy is especially great in the area of
tectonic dislocations, where permeability in various directions may differ
several times. Water exchange between the mines is inhibited by extensive
karst zones running along the mine field boundaries between Sompa and
Viru, and Ahtme and Tammiku mines. At the same time, karst zones running
transversely to the mine boundary increase the water exchange between Sompa
and Kohtla mines. Additionally, the water exchange is affected by the properties
of the mined area, which depend on the roof handling methods used. In the area
Table 4. Permeability of the Keila–Kukruse groundwater aquifer in the
mining district
Filtration module Publication
District Permeability,
m2
/d
Estimated difference
in water tables,
m m/h m/d
Kohtla – Aidu,
northern part
1200 5 10 240
Kohtla – Aidu,
central part
780 10 3.25 78
[8]
Kohtla 6–60
Viru 10–40
[7]
Aidu, generalized 393 10 1.6 39
Ahtme, generalized 335 10 1.4 34
[4]
Tammiku 4–20
Ahtme 1–15
[7]
Ahtme – Estonia 90 10 0.38 9 [4]
No. 2 – Tammiku 0.24 6 [10]
mined using roof caving the water-bearing horizon is thicker and of higher
permeability than in the area of room-and-pillar mining.
Because of high uncertainty the calculation of the water amounts moving
between the closed mines is complicated, not only due to the variability in L,
l, k, but also due to the lack of the relation uniquely describing all the
situations. Therefore the present study makes use of the balance method,
which unites the amounts of the water pumped out of the working mines,
and of precipitation and groundwater infiltrating into the mine. The relation
between these amounts is expressed by the approximate formula
qij = 365.25 × Lij × kij × (dhij/2) / (1000 × lij),
where
qij – the amount of the water migrating from one mine (i) to the other (j),
million m3
/y,
Lij – length of the barrier between these mines, km,
lij – average thickness of the barrier, m,
dhji – difference between the water levels of two closed mines at the
moment of modelling, m,
kij – factor characterizing the permeability of the area between the mines
(barriers and overlying rock), which, with some reservation, can be
considered as generalized permeability, m2
/d.
As model input we use the measurements of the barriers between the
mines, volume of the water pumped out of the working mines (especially
changes in it due to the closure of neighbouring mines), amount of precipita-
tion and its relation to mine pumping [2]. The variable parameter of the
Technogenic Water in Closed Oil Shale Mines 25
model is generalized permeability, which is used to balance the model.
Permeability was fitted into the model taking into consideration the informa-
tion available (Table 4), location of mines with respect to tectonic fault
zones and the orientation of the karst zones lying between the mines. The
balanced model can be used for calculating the migrating water amounts by
fluctuations in water level, for example during floods and heavy rains, but
also for planning water level regulations.
The model output is the matrix of water exchange (Table 5), where
• “North” denotes the northern closed mines No. 2, Kukruse, and Käva
and its satellite mines
• “West” denotes the western closed mines Kohtla, Sompa and No. 4
• “Vasavere” is the area east of Ahtme and Estonia mines
• The water amounts in the matrix of water exchange are given in
million m3
/y, whereas (+) shows the amounts infiltrating into the mine (i)
from the mine (j) and (–) shows the amounts migrating from the mine (i)
to the other mine.
Explanations to the matrix of water exchange are given in Table 6. Water
movement inside the water body and the amounts of mine pumping are
shown in Fig. 1. The values presented characterize the state of the water body
in the year 2004, but as we have to do with a pilot model, these are all
approximate.
Table 5. Matrix of water exchange, year 2004, 106
m3
/y
↓Elements
of the water
body
→
Aidu Estonia Viru Ahtme Tammiku North West Vasavere Jõhvi
city Sum
Working mines:
Aidu 0.00 0.00 0.00 0.00 0.00 0.00 14.46 0.00 0.00 14.46
Estonia 0.00 0.00 1.64 6.48 0.00 0.00 0.00 0.48 0.00 8.60
0.00 0.00 –1.64 0.00 0.18 7.23 0.00 3.07 0.00 0.00 8.83
Technogenic water body; closed mines (sub-bodies):
Ahtme 0.00 –6.48 –0.18 0.00 0.07 0.00 0.00 –1.07 0.00 –7.65
Tammiku 0.00 0.00 –7.23 –0.07 0.00 2.28 –1.69 –0.50 0.00 –7.22
North 0.00 0.00 0.00 0.00 –2.28 0.00 –4.60 0.00 –0.15 –7.03
West –
14.46
0.00 –3.07 0.00 1.69 4.60 0.00 0.00 0.00 –11.24
Geographical sites:
Vasavere 0.00 –0.48 0.00 1.07 0.50 0.00 0.00 0.00 0.00 1.09
Town of
Jõhvi
0.00 0.00 0.00 0.00 0.00 0.15 0.00 0.00 0.00 0.15
Table 6. Water exchange between mines
Mines, techno-
genic water
sub-bodies and
geographical
sites
Water
exchange,
106
m3
/y
Comments
Working mines:
Aidu 14.46 Inflow from closed Kohtla mine
Estonia 8.60 Main inflow from closed Ahtme mine, less from the direction of
working Viru mine, partly also from the east
Viru 8.83 Inflow from closed Tammiku and Sompa mines, slight outflow
into Estonia mine
Technogenic water body; closed mines (sub-bodies):
Ahtme –7.65 Outflow mainly into Estonia mine and into the catchment area
of the Pühajõgi River through springs and outflow wells
Tammiku –7.22 Intensive water exchange with other parts of the water body,
out flow into the catchment area of the Pühajõgi River through
a caving at Kose
Northern closed
mines Käva,
Kukruse and
No. 2
–7.03 Feeds other closed mines, outflow via Vahtsepa ditch into the
Kohtla River
Western closed
mines Kohtla,
Sompa and
Mine No 4.
–11.24 Intensive water exchange with other parts of the water body,
feeds mostly Aidu opencast
Geographical sites:
Vasavere 1.09 Water inflow mostly from Ahtme mine, to some extent also
from closed Tammiku mine
Town of Jõhvi 0.15 Water infiltrates from closed mine No. 2
Conclusions and recommendations
No great changes in the water level of closed mines and its seasonal
variation are expected if no measures are taken. The situation should not
change after the closure of presently working mines either. In future the
water level of flooded Aidu opencast will be regulated by an outlet into the
Ojamaa River at 40–42 m level, which will be also the common water level
in Kohtla and Sompa mines. In the area of Viru and Estonia mines the
groundwater will rise to the pre-mining level, which will result in an increase
in groundwater flow into the Pühajõgi River at the eastern margin of
Tammiku and Ahtme mines.
It may turn necessary to regulate water level in the mining district. In
order to reduce the flow of groundwater from mine No. 2 to the lower, area
of the town of Jõhvi, the following options could be considered:
• outlet of water at 51 m level at the northern boundary of the mine, near
the adit of unbuilt mine No. 1
Technogenic Water in Closed Oil Shale Mines 27
• blasting of the barrier between mine No. 2 and Käva and Tammiku mines
to enable water outflow towards the Kohtla River (at a level of 51 m) or
into the Pühajõgi River (at 45–47 m level)
• building of a pumping station regulating the water level and operating
seasonally, but this is evidently not efficient due to great expenses.
In order to reduce the water amounts penetrating into working mines and
towards Vasavere intake, it would be purposeful to lower the water level in
several closed mines:
• to 45 m level in Tammiku mine, by dredging the present outlet
• to 42–43 m level in Ahtme mine, by drilling artesian wells
The quality of the water of closed mines is improving. The content of
sulphates and iron in mine water decreases and in about five years after the
closure of the mine is below the maximum level permitted in drinking water.
Monitoring the water quality in closed mines should be aimed mostly at
protecting the water body from surface-derived pollution. The sampling
methods should be improved, with indicating justified times and places for
taking water samples. In some cases the number of parameters measured
could be reduced.
As no reliable data are available about the formation and distribution of
phenols in the water of closed mines, corresponding investigations are
needed before the use of the water. Although phenols are generally believed
to originate from the waste of shale oil plants or from burning spoil dumps,
the possibility of their formation during decomposition of kerogen in water-
filled mines cannot be excluded either. This hypothesis deserves further
special study.
Acknowledgements
This paper was written within the framework of Grant 5913 of the
Estonian Science Foundation “Usage of mined-out areas”, using the database
of research No. 416L “Forecast of hydrogeological changes resulting from
the activities of the Estonian Oil Shale Mining Company” carried out by
Tallinn University of Technology.
REFERENCES
1. Reinsalu, E. Sillamäe uranium mine // Environment Technics. 2001. No. 2. P.
40–45 [in Estonian].
2. Reinsalu, E. Changes in mine dewatering after the closure of exhausted oil shale
mines // Oil Shale. 2005. Vol. 22, No. 3. P. 261–273.
3. Erg, K. Changes in groundwater sulphate content in Estonian oil shale mining
area // Oil Shale. 2005. Vol. 22, No. 3. P. 275–289.
28 E. Reinsalu, I. Valgma, H. Lind, K. Sokman
4. Savitski, L., Savva, V. Prognosis of hydrogeological changes in the mining
district of the Estonian oil shale deposit, stages 1–3, 2001 [in Estonian]
5. Reinsalu, E., Toomik, A., Valgma, I. Mined out land, Tallinn, 2002 [in
Estonian].
6. Butakova, A., Jürgenfeldt, G., Reinsalu, E. Assessment of the mine water
volume of water-filled oil shale mines // Gorjutšie slancy. 1980. No. 1. P. 6 [in
Russian].
7. Parahonski, E. Formation of mine water in oil shale mines and opencasts and
mine drainage. Tallinn, Valgus, 1983 [in Russian].
8. Domanova, N., Reinsalu, E. Analysis of hydrogeological conditions in Oktoobri
opencast, Topic 0107, Stage HD No. 1, Estonian Branch of A. Skotchinski
Institute of Mining Engineering, 1979 [in Russian].
9. Domanova, N. Formation and forecast of water flowing into the mine workings
driven into carbonate rocks with uneven infiltration properties. Candidate’s
thesis, A. Skotchinski Institute of Mining Engineering, 1986 [in Russian].
10. Domanova, N. Predicted increase in the water inflow into Viru mine due to the
flooding of Tammiku mine. Estonian Oil Shale Company, Jõhvi, 1999. Manu-
script [in Russian].
Recieved June 20, 2005
Oil Shale, 2006, Vol. 23, No. 1 ISSN 0208-189X
pp. 15–28 © 2006 Estonian Academy Publishers
The present paper is based on the results of the research conducted in 2004
by the Department of Mining of the Tallinn University of Technology and
Estonian Oil Shale Company. The state of the technogenic water body that
has formed in the central part of the oil shale deposit is analysed: the water
level in the area of the stopped and closed mines, water amount and move-
ment direction, water quality and its changes. The state of the water is
assessed and predicted using modelling of the water tables, statistical
analysis of the water quality parameters and the pilot model for describing
the migration of water. The results show that the technogenic water body
studied is in a relatively stable state, and the quality of the groundwater in
that area is fast improving approaching the drinking water standards.
Introduction
The Estonia oil shale deposit comprises about ten closed and stopped
deep mines that are fully or partly filled with water (Table 1). Eight mines in
the central part of the deposit: Ahtme, Kohtla, Kukruse, Käva, Sompa,
Tammiku and mines Nos. 2 and 4 form one water body. After Ahtme mine
was filled with water in December 2004 (Fig. 1), the water body turned
relatively stable. Ubja mine and joint Kiviõli and Küttejõu mine are located
in the western part of the deposit, farther away from the other mines. In addi-
tion to oil shale mines, Sillamäe uranium mine (1949–1952) [1], and Ülgase
(1922–1938) and Maardu phosphorite mines (1942–1965) have been closed
in Estonia. The water regime in these mines has not been studied yet and is
not discussed in the present paper.
*
Table 1. Closed and flooded underground oil shale mines
Mine
Closed –
(pumps
were
stopped)
Mined
area,
km2
*
Water table
a.s.l.,
m
Outflow regulating
the water table
Approximate
water volume,
106
m3
Central part of the deposit:
Kukruse 1967 13 51–54 Mostly into Käva and
Jõhvi mines
3.5–6**
Käva and
Käva-2
1973 18 51–52 From an old adit into
Vahtsepa ditch
9–11**
Mine No. 2
(Jõhvi mine)
1974 13 51–56 Mostly into Tammiku
mine, during flood
to Jõhvi city
10–11**
Mine No. 4 1975 13 41–42 Mostly into neigh bouring mines
3–8**
Tammiku December
1999
40 44–48 Into the Kose River
and Viru mine
34
Sompa February
2000
27 40–45 Into neighbouring
mines
23
Kohtla June
2001
17 39–42 Into Aidu opencast 13
Ahtme December
2001 –
December
2002
35 ≈ 47 From drill holes and
springs into Sanniku
brook
36
Separate mines in the western part of the deposit
Kiviõli &
Küttejõu
1989 29 41 ± 0.5 From a ditch into the
Purtse River
Up to 29
Ubja 1960 2 ≈ 55 From an adit into the
Toolse River
Not determined
Total ≈ 170
* [5]
** Depending on the water level [6]
As a rule, the mine workings and groundwater cone of depression formed
during mining fill with water after the cease of mine pumping. The degree of
filling depends on the mining depth and the height of outflow. The tunnels of
Ahtme, Sompa and Tammiku mines are completely, those of mines Nos. 2
and 4 almost completely water-filled. The rest of the mines (Kiviõli, Kukruse
and Käva) contain areas with dry floor. The museum founded in Kohtla mine
is dry because of to the draining effect of Aidu opencast and the water
barriers surrounding the exposition area. The water level changes depending
Technogenic Water in Closed Oil Shale Mines 17
10
15
20
25
30
35
40
45
50
2002 2003 2004 2005
Water level, m
Tarakuse well Pagari well
Fig. 1. Increase in the water table in closed Ahtme mine
on the amount of precipitation and water exchange with neighbouring mines.
The rate and amplitude of the changes differ from mine to mine.
Several problems have arisen from the flooding of the closed mines.
First, the technogenic water body started to affect the amount of the water
pumped out of the working mines and its seasonal variation [2]. Clearly, the
water of the closed mines will influence also the new mines, planned to be
constructed in the Ojamaa and Uus-Kiviõli mine fields. Second, the environ-
ment is affected by the water that in several places has risen to the pre-
mining level (of the year 1945) and by the new springs formed. Several
projects have been undertaken to fight the flooding, and it has turned out that
no sufficient source data for mine planning are available. Third, the water of
the closed mines is an easily accessible water resource, thus it is important to
know and predict its quality [3]. Prediction of the mine water quality is
essential also because of the fact that groundwater elevation in the mine field
has started to affect the water supply of the region – the water richer in
sulphates runs into the outdated and leaky common wells. It has also been
prognosticated that if the groundwater table rises higher than 45–47 m, the
water in the Ahtme mine field will affect the water level and quality of the
Vasavere intake [4]. Fourth, the land above old mines has subsided and the
rocks are fractured, therefore the technogenic groundwater is weakly protected
and the contribution of precipitation to groundwater formation is very high.
Water level
The present study is based on the water level measurement data (incl.
archive data) provided by the Estonian Oil Shale Company, Geological
Fig. 2. Map of the technogenic water body
Technogenic Water in Closed Oil Shale Mines 19
Survey of Estonia and Municipality of the town of Jõhvi. The water levels of
the Keila–Kukruse, Lasnamäe–Kunda and Nabala–Rakvere aquifers, closed
mines and main outlets were measured on an average period of 20 years.
New data were obtained in the years 2003 and 2004. Field works and
monitoring started in the spring of 2004 and are still going on.
An essential part of the research was the modelling of the level of the
Keila–Kukruse aquifer in the stationary regime. The modelling area included
the central part of the deposit – underground mines and Aidu opencast. Data
from about 50 observation wells were used. The water level of working mines
was described at the level of the oil shale bed floor. Closed mines were treated
as independent water sub-bodies, where the water level is constant at a certain
moment of time (Table 1). The MapInfo Professional software was used,
combined with the modelling package Vertical Mapper. The comparison and
calibration of the intermediate results obtained and discussions held showed
that the best interpolation method was triangulation with smoothing, because
in that case interpolation takes place only between data points or observation
wells, without modelling the situation outside the study area.
During the first stage of the research the state of the water body in August
2004 was assessed. According to the measurements and calculations performed,
precipitation accounts for up to 70% of the water pumped out of mines [2]. The
autumn–winter season of 2004 was rich in precipitation, with little snow and
relatively warm. Therefore it could be expected that Ahtme mine would fill with
water sooner than predicted [4]. To check that hypothesis, the model was
calibrated at the second stage of the research in December 2004. The contour
map of the modelled water table is shown in Fig. 2.
By continuous improvement of the existing and addition of new data
more than ten two- and three-dimensional map versions were completed.
The model enabled us to assess the water levels in different mines and their
border areas and to make assumptions and predictions about the water move-
ment directions.
Water quality
In the years 2000–2004 the department of environmental services of the
Estonian Oil Shale Company had the waters of all closed mines analysed. The
samples were taken at six sites in four mines in different seasons. Analyses
were made at the central laboratory of the Estonian Oil Shale Company
(3 analyses), in Tartu Environmental Research Ltd. (2 analyses) and in the
Geological Survey of Estonia (12 analyses). Up to 16 quality parameters were
determined. The results of the analyses are presented in Table 2.
The quality parameters are arranged in Table 2 in the decreasing order of
the variation in measurement results. At first glance only the average contents
of iron, sulphates and phenols obtained for the observation period do not meet
the drinking water standards. This cannot be a final conclusion. The average
Table 2. Water quality parameters in closed Ahtme, Kohtla,
Sompa and Tammiku mines
Quality
parameter Unit
Number of
measurement
results
Numerical data for the entire period
(2000–2004)
Leachates Total Certain
numerical
values
Arithmetical
mean
Standard
deviation
Variation
coefficient
Max. levels
permitted in
drinking
water
Total Fe mg/l 14 10* 0.69 1.16 1.67 <0.2
NO3
-
mg/l 15 11* 11.7 18.55 1.58 <50
NO2
-
mg/l 12 7* 0.015 0.0166 1.10 <0.5
SO4
2- mg/l 15 15 342.4 240.2 0.70 <250
Dry residue mg/l 14 14 845.5 569.6 0.67 –
Mg2+ mg/l 15 15 51.6 32.58 0.63 –
K+
mg/l 13 13 12.9 8.11 0.63 –
Ca2+ mg/l 15 15 174.5 107.6 0.62 –
Na+
mg/l 14 14 10.4 6.33 0.61 <200
Cl mg/l 15 15 16.4 9.74 0.59 <250
Total hardness mge/l 13 13 13.72 7.04 0.51 –
Oil products mg/l 15 4* 0.15 0.073 0.49 <0.05
Conductivity μS/cm 14 14 1095 477.6 0.44 <2500
NH4
+
mg/l 12 2* 0.017 0.0064 0.39 <0.5
Total phenols mg/l 15 4** 0.0017 0.00049 0.28 <0.0005
pH 15 15 7.1 0.33 0.05 6.5–9.5
* due to the lack of a certain numerical value the result was smaller than the preciseness of the
laboratory tests, but not exceeding the limits permitted in drinking water
** due to the lack of a certain numerical value the result was smaller than the preciseness of
the laboratory tests, in two cases not exceeding the limits permitted in drinking water; rest of
the samples gave no unique result
Notes:
Quality parameters are ordered according to the variation coefficient.
The shaded lines contain the measurement results the average of which does not meet the
Estonian drinking water standard.
The content of benzo(a)pyrene was measured in 11 samples. The results are not included in
the table because no certain numerical values were obtained. In all samples the benzo(a)
pyrene content was lower than the permitted maximum value.
and standard deviations given in the table have been calculated for all closed
mines and for the entire observation period, thus they characterize only the
data set and not the quality of water or a particular mine. Variation in the
measurement results is caused by influential as well as random factors.
Influential factors are the sampling site (mine) and the time span that has passed
since the closure of the mine. Let us treat this assumption as a working
hypothesis. A random factor is the season when sampling was performed. For
example, in the years 2000 and 2001 samples were taken in summer, in 2002–
2004 in autumn. Surely the water quality parameters depend also on the
Technogenic Water in Closed Oil Shale Mines 21
location of the sampling site in the mine field. Some part of variations result
from the methodology of sampling and laboratory tests. The reliability of
iron content analyses carried out in different laboratories could be questioned.
The phenol content of mine water, measured repeatedly during mining, has
been 0.003 ± 0.001 mg/l, except for Kiviõli mine, which has been strongly
affected by chemical industry. Here the phenol content of mine water was
0.38 mg/l [7].
For preliminary checking of the working hypothesis we conducted a two-
factor (place and time) variation analysis of the sulphate and iron contents of
Tammiku and Sompa mine waters. The results of sulphate analysis are given
in Table 3. We can see that the hypothesis of the influence of place and time
on the sulphate content of water is relatively strong (probability of a counter-
hypothesis 18.0 and 18.8% respectively). The residual standard deviation
(187 mg/l), however, is too large for making definite conclusions. Obviously
the result is influenced by taking samples in different seasons. An analogous
result was obtained by the variation analysis of the iron content, whereas the
impact of time turned out to be small. Possibly this could result from the
treatment of samples in different laboratories.
In spite of great uncertainty of measurement, the sulphate and iron
contents decrease with time. This trend is depicted by graphs in Fig. 3. As
could be expected, the purification of water is best described by the
exponential function. The constants in the formulae (801 and 0.77 mg/l,
respectively) characterize the average concentrations at the initial moment of
the dilution process (at the closure of mines) and the time factors (–0.386
and –0.507, respectively) show the rate of water purification. The half-life of
the concentration calculated on the basis of time factors, i.e. the time period
during which the content of a component decrease twice, is about 1.8 years
for sulphates and 1.4 years for iron. From the half-life and graphs we may
presume that in about five years after the closure of a mine the content of
sulphates and iron decreases below the maximum permitted level in drinking
water. The highest permitted content of iron in first-class drinking water is
0.2 m/l and that of sulphates 250 m/l.
The data on all mines are included in the graphs of Fig. 3. The measure-
ments revealed varying initial concentrations of sulphates for different
mines. The highest concentration was recorded in the first sample from
Ahtme mine, the lowest in Kohtla mine. Actually, this is not the initial level,
since the first samples were taken 4–11 months after the pumps had been
stopped. Approximating the results obtained from the samples of each mine
separately, we get theoretical dilution of the initial concentration level at the
zero moment, about 2200 mg/l for Ahtme and 300 mg/l for Sompa. These
values refer to a relation between the depth of the mine and the initial
concentration of sulphates. The hydrogeological background of this pheno-
menon is discussed by Erg [3].
Table 3. Results of the variation analysis of the content of sulphates
Source of Variation df MS F P-value
Mines (Tammiku, Sompa) 1 91681 2.63 0.180
Years (2002–2004) 4 92788 2.66 0.183
Error 4 34924
Residual Standard Deviation 187 mg/l
Total 9
SO4
2- = 801 e-0.386 t, mg/l
R2
= 0.46
10
100
1000
10000
01234567
t - closed, years
SO42- - sulphate content, mg/l
250 mg/l
Fe = 0.77 e -0.509 t , mg/l
R2
= 0.39
0.01
0.1
1
10
01234567
t - closed, years
Fe content, mg/l
0.2 mg/l
Fig. 3. Decrease in the content of SO4
2- and Fe in closed
mines.
250 mg/l and 0.2 mg/l – maximum permitted levels in
drinking water.
The water quality parameters for which we had at least 14 reliable
measurement results (pH, electric conductivity, total hardness, Cl-
, dry
Technogenic Water in Closed Oil Shale Mines 23
residue, Na+
, Ca2+, Mg2+, K+
and SO4
2- ) were subjected to correlation
analysis. From the analysis we could conclude the following:
• The content of sulphates can be considered a good indicator of mine
water quality, because it correlates well with most of the other water
quality parameters, except for K+
.
• Electric conductivity can be successfully used for rapid assessment of
water quality, because it correlates well with sulphates as well as with
other main parameters (except for K+
).
• pH is not informative enough, because it does not correlate with any
other water quality parameter.
Pilot model of water exchange
Continuous water exchange is going on between the closed mines. The
water penetrating into mines is derived mostly from precipitation, less from
groundwater. The part of the water not flowing out of the mine (Table 1)
infiltrates into the neighbouring mines or feeds aquifers. The water pumped
out of the working mines is formed of precipitation, groundwater and the
water coming from closed mines. Intensity of water exchange depends on
the length (L, km) and thickness (l, m) of the barrier left between the mines,
difference between the water levels of neighbouring mines (dh, m) and
permeability of the barrier and overburden (km, m2
/d). The longer and thinner
is the barrier, the greater is the water level difference in neighbouring water
bodies, and the higher is the permeability of rocks in the areas separating the
mines, the more intensive is the exchange of water.
The water levels of the closed mines are precisely known. The measure-
ments of barriers can be obtained from the plan of mining works, but the
length and thickness of the barriers are highly variable. Little data are
available on the permeability of pillars and bedrock. As seen in Table 4, the
permeability of the Keila–Kukruse aquifer differs up to 10 times within the
limits of the deposit.
Water permeability is largely affected by the geological disturbance of
the Earth crust (mostly karst zones), which makes the aquifer highly aniso-
tropic [8, 9]. In the Estonia mine field twofold difference in the permeability
in the northeastern and southeastern directions has been recorded. According
to the data by Domanova, anisotropy is especially great in the area of
tectonic dislocations, where permeability in various directions may differ
several times. Water exchange between the mines is inhibited by extensive
karst zones running along the mine field boundaries between Sompa and
Viru, and Ahtme and Tammiku mines. At the same time, karst zones running
transversely to the mine boundary increase the water exchange between Sompa
and Kohtla mines. Additionally, the water exchange is affected by the properties
of the mined area, which depend on the roof handling methods used. In the area
Table 4. Permeability of the Keila–Kukruse groundwater aquifer in the
mining district
Filtration module Publication
District Permeability,
m2
/d
Estimated difference
in water tables,
m m/h m/d
Kohtla – Aidu,
northern part
1200 5 10 240
Kohtla – Aidu,
central part
780 10 3.25 78
[8]
Kohtla 6–60
Viru 10–40
[7]
Aidu, generalized 393 10 1.6 39
Ahtme, generalized 335 10 1.4 34
[4]
Tammiku 4–20
Ahtme 1–15
[7]
Ahtme – Estonia 90 10 0.38 9 [4]
No. 2 – Tammiku 0.24 6 [10]
mined using roof caving the water-bearing horizon is thicker and of higher
permeability than in the area of room-and-pillar mining.
Because of high uncertainty the calculation of the water amounts moving
between the closed mines is complicated, not only due to the variability in L,
l, k, but also due to the lack of the relation uniquely describing all the
situations. Therefore the present study makes use of the balance method,
which unites the amounts of the water pumped out of the working mines,
and of precipitation and groundwater infiltrating into the mine. The relation
between these amounts is expressed by the approximate formula
qij = 365.25 × Lij × kij × (dhij/2) / (1000 × lij),
where
qij – the amount of the water migrating from one mine (i) to the other (j),
million m3
/y,
Lij – length of the barrier between these mines, km,
lij – average thickness of the barrier, m,
dhji – difference between the water levels of two closed mines at the
moment of modelling, m,
kij – factor characterizing the permeability of the area between the mines
(barriers and overlying rock), which, with some reservation, can be
considered as generalized permeability, m2
/d.
As model input we use the measurements of the barriers between the
mines, volume of the water pumped out of the working mines (especially
changes in it due to the closure of neighbouring mines), amount of precipita-
tion and its relation to mine pumping [2]. The variable parameter of the
Technogenic Water in Closed Oil Shale Mines 25
model is generalized permeability, which is used to balance the model.
Permeability was fitted into the model taking into consideration the informa-
tion available (Table 4), location of mines with respect to tectonic fault
zones and the orientation of the karst zones lying between the mines. The
balanced model can be used for calculating the migrating water amounts by
fluctuations in water level, for example during floods and heavy rains, but
also for planning water level regulations.
The model output is the matrix of water exchange (Table 5), where
• “North” denotes the northern closed mines No. 2, Kukruse, and Käva
and its satellite mines
• “West” denotes the western closed mines Kohtla, Sompa and No. 4
• “Vasavere” is the area east of Ahtme and Estonia mines
• The water amounts in the matrix of water exchange are given in
million m3
/y, whereas (+) shows the amounts infiltrating into the mine (i)
from the mine (j) and (–) shows the amounts migrating from the mine (i)
to the other mine.
Explanations to the matrix of water exchange are given in Table 6. Water
movement inside the water body and the amounts of mine pumping are
shown in Fig. 1. The values presented characterize the state of the water body
in the year 2004, but as we have to do with a pilot model, these are all
approximate.
Table 5. Matrix of water exchange, year 2004, 106
m3
/y
↓Elements
of the water
body
→
Aidu Estonia Viru Ahtme Tammiku North West Vasavere Jõhvi
city Sum
Working mines:
Aidu 0.00 0.00 0.00 0.00 0.00 0.00 14.46 0.00 0.00 14.46
Estonia 0.00 0.00 1.64 6.48 0.00 0.00 0.00 0.48 0.00 8.60
0.00 0.00 –1.64 0.00 0.18 7.23 0.00 3.07 0.00 0.00 8.83
Technogenic water body; closed mines (sub-bodies):
Ahtme 0.00 –6.48 –0.18 0.00 0.07 0.00 0.00 –1.07 0.00 –7.65
Tammiku 0.00 0.00 –7.23 –0.07 0.00 2.28 –1.69 –0.50 0.00 –7.22
North 0.00 0.00 0.00 0.00 –2.28 0.00 –4.60 0.00 –0.15 –7.03
West –
14.46
0.00 –3.07 0.00 1.69 4.60 0.00 0.00 0.00 –11.24
Geographical sites:
Vasavere 0.00 –0.48 0.00 1.07 0.50 0.00 0.00 0.00 0.00 1.09
Town of
Jõhvi
0.00 0.00 0.00 0.00 0.00 0.15 0.00 0.00 0.00 0.15
Table 6. Water exchange between mines
Mines, techno-
genic water
sub-bodies and
geographical
sites
Water
exchange,
106
m3
/y
Comments
Working mines:
Aidu 14.46 Inflow from closed Kohtla mine
Estonia 8.60 Main inflow from closed Ahtme mine, less from the direction of
working Viru mine, partly also from the east
Viru 8.83 Inflow from closed Tammiku and Sompa mines, slight outflow
into Estonia mine
Technogenic water body; closed mines (sub-bodies):
Ahtme –7.65 Outflow mainly into Estonia mine and into the catchment area
of the Pühajõgi River through springs and outflow wells
Tammiku –7.22 Intensive water exchange with other parts of the water body,
out flow into the catchment area of the Pühajõgi River through
a caving at Kose
Northern closed
mines Käva,
Kukruse and
No. 2
–7.03 Feeds other closed mines, outflow via Vahtsepa ditch into the
Kohtla River
Western closed
mines Kohtla,
Sompa and
Mine No 4.
–11.24 Intensive water exchange with other parts of the water body,
feeds mostly Aidu opencast
Geographical sites:
Vasavere 1.09 Water inflow mostly from Ahtme mine, to some extent also
from closed Tammiku mine
Town of Jõhvi 0.15 Water infiltrates from closed mine No. 2
Conclusions and recommendations
No great changes in the water level of closed mines and its seasonal
variation are expected if no measures are taken. The situation should not
change after the closure of presently working mines either. In future the
water level of flooded Aidu opencast will be regulated by an outlet into the
Ojamaa River at 40–42 m level, which will be also the common water level
in Kohtla and Sompa mines. In the area of Viru and Estonia mines the
groundwater will rise to the pre-mining level, which will result in an increase
in groundwater flow into the Pühajõgi River at the eastern margin of
Tammiku and Ahtme mines.
It may turn necessary to regulate water level in the mining district. In
order to reduce the flow of groundwater from mine No. 2 to the lower, area
of the town of Jõhvi, the following options could be considered:
• outlet of water at 51 m level at the northern boundary of the mine, near
the adit of unbuilt mine No. 1
Technogenic Water in Closed Oil Shale Mines 27
• blasting of the barrier between mine No. 2 and Käva and Tammiku mines
to enable water outflow towards the Kohtla River (at a level of 51 m) or
into the Pühajõgi River (at 45–47 m level)
• building of a pumping station regulating the water level and operating
seasonally, but this is evidently not efficient due to great expenses.
In order to reduce the water amounts penetrating into working mines and
towards Vasavere intake, it would be purposeful to lower the water level in
several closed mines:
• to 45 m level in Tammiku mine, by dredging the present outlet
• to 42–43 m level in Ahtme mine, by drilling artesian wells
The quality of the water of closed mines is improving. The content of
sulphates and iron in mine water decreases and in about five years after the
closure of the mine is below the maximum level permitted in drinking water.
Monitoring the water quality in closed mines should be aimed mostly at
protecting the water body from surface-derived pollution. The sampling
methods should be improved, with indicating justified times and places for
taking water samples. In some cases the number of parameters measured
could be reduced.
As no reliable data are available about the formation and distribution of
phenols in the water of closed mines, corresponding investigations are
needed before the use of the water. Although phenols are generally believed
to originate from the waste of shale oil plants or from burning spoil dumps,
the possibility of their formation during decomposition of kerogen in water-
filled mines cannot be excluded either. This hypothesis deserves further
special study.
Acknowledgements
This paper was written within the framework of Grant 5913 of the
Estonian Science Foundation “Usage of mined-out areas”, using the database
of research No. 416L “Forecast of hydrogeological changes resulting from
the activities of the Estonian Oil Shale Mining Company” carried out by
Tallinn University of Technology.
REFERENCES
1. Reinsalu, E. Sillamäe uranium mine // Environment Technics. 2001. No. 2. P.
40–45 [in Estonian].
2. Reinsalu, E. Changes in mine dewatering after the closure of exhausted oil shale
mines // Oil Shale. 2005. Vol. 22, No. 3. P. 261–273.
3. Erg, K. Changes in groundwater sulphate content in Estonian oil shale mining
area // Oil Shale. 2005. Vol. 22, No. 3. P. 275–289.
28 E. Reinsalu, I. Valgma, H. Lind, K. Sokman
4. Savitski, L., Savva, V. Prognosis of hydrogeological changes in the mining
district of the Estonian oil shale deposit, stages 1–3, 2001 [in Estonian]
5. Reinsalu, E., Toomik, A., Valgma, I. Mined out land, Tallinn, 2002 [in
Estonian].
6. Butakova, A., Jürgenfeldt, G., Reinsalu, E. Assessment of the mine water
volume of water-filled oil shale mines // Gorjutšie slancy. 1980. No. 1. P. 6 [in
Russian].
7. Parahonski, E. Formation of mine water in oil shale mines and opencasts and
mine drainage. Tallinn, Valgus, 1983 [in Russian].
8. Domanova, N., Reinsalu, E. Analysis of hydrogeological conditions in Oktoobri
opencast, Topic 0107, Stage HD No. 1, Estonian Branch of A. Skotchinski
Institute of Mining Engineering, 1979 [in Russian].
9. Domanova, N. Formation and forecast of water flowing into the mine workings
driven into carbonate rocks with uneven infiltration properties. Candidate’s
thesis, A. Skotchinski Institute of Mining Engineering, 1986 [in Russian].
10. Domanova, N. Predicted increase in the water inflow into Viru mine due to the
flooding of Tammiku mine. Estonian Oil Shale Company, Jõhvi, 1999. Manu-
script [in Russian].
Recieved June 20, 2005
Tellimine:
Postitused (Atom)