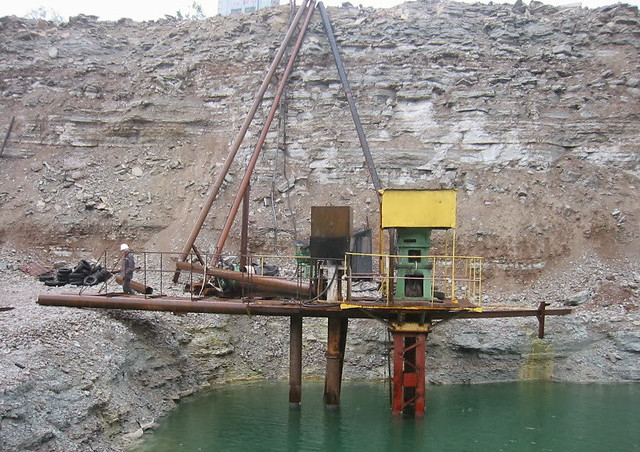
..ja kui tranšeed ei nimetatud settebasseiniks..
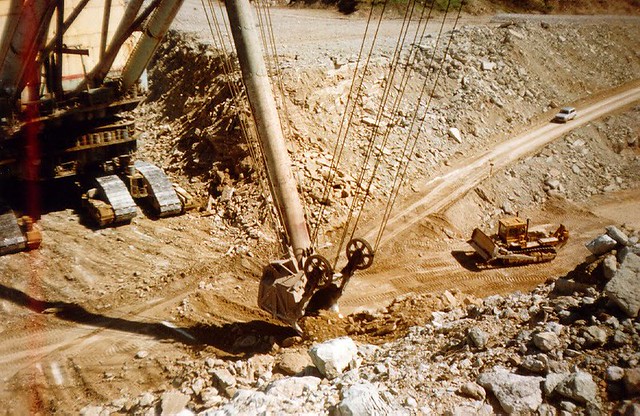
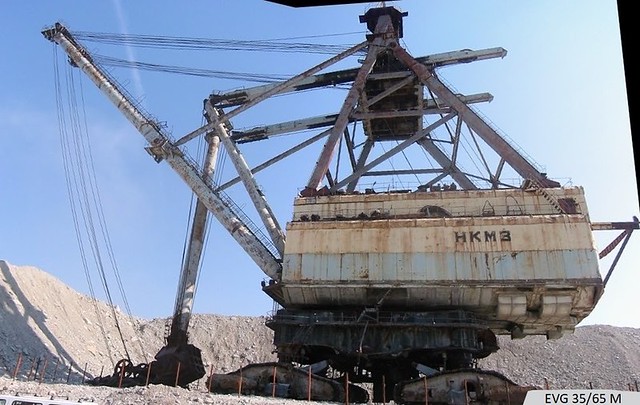
..kui EVG35/65M ei olnud sammuv ekskavaator..



https://ingo-valgma.blogspot.com/search?q=Aidu

 Oil Shale, 2006, Vol. 23, No. 1 ISSN 0208-189X pp. 15–28 © 2006 Estonian Academy Publishers The present paper is based on the results of the research conducted in 2004 by the Department of Mining of the Tallinn University of Technology and Estonian Oil Shale Company. The state of the technogenic water body that has formed in the central part of the oil shale deposit is analysed: the water level in the area of the stopped and closed mines, water amount and move- ment direction, water quality and its changes. The state of the water is assessed and predicted using modelling of the water tables, statistical analysis of the water quality parameters and the pilot model for describing the migration of water. The results show that the technogenic water body studied is in a relatively stable state, and the quality of the groundwater in that area is fast improving approaching the drinking water standards. Introduction The Estonia oil shale deposit comprises about ten closed and stopped deep mines that are fully or partly filled with water (Table 1). Eight mines in the central part of the deposit: Ahtme, Kohtla, Kukruse, Käva, Sompa, Tammiku and mines Nos. 2 and 4 form one water body. After Ahtme mine was filled with water in December 2004 (Fig. 1), the water body turned relatively stable. Ubja mine and joint Kiviõli and Küttejõu mine are located in the western part of the deposit, farther away from the other mines. In addi- tion to oil shale mines, Sillamäe uranium mine (1949–1952) [1], and Ülgase (1922–1938) and Maardu phosphorite mines (1942–1965) have been closed in Estonia. The water regime in these mines has not been studied yet and is not discussed in the present paper. * Table 1. Closed and flooded underground oil shale mines Mine Closed – (pumps were stopped) Mined area, km2 * Water table a.s.l., m Outflow regulating the water table Approximate water volume, 106 m3 Central part of the deposit: Kukruse 1967 13 51–54 Mostly into Käva and Jõhvi mines 3.5–6** Käva and Käva-2 1973 18 51–52 From an old adit into Vahtsepa ditch 9–11** Mine No. 2 (Jõhvi mine) 1974 13 51–56 Mostly into Tammiku mine, during flood to Jõhvi city 10–11** Mine No. 4 1975 13 41–42 Mostly into neigh bouring mines 3–8** Tammiku December 1999 40 44–48 Into the Kose River and Viru mine 34 Sompa February 2000 27 40–45 Into neighbouring mines 23 Kohtla June 2001 17 39–42 Into Aidu opencast 13 Ahtme December 2001 – December 2002 35 ≈ 47 From drill holes and springs into Sanniku brook 36 Separate mines in the western part of the deposit Kiviõli & Küttejõu 1989 29 41 ± 0.5 From a ditch into the Purtse River Up to 29 Ubja 1960 2 ≈ 55 From an adit into the Toolse River Not determined Total ≈ 170 * [5] ** Depending on the water level [6] As a rule, the mine workings and groundwater cone of depression formed during mining fill with water after the cease of mine pumping. The degree of filling depends on the mining depth and the height of outflow. The tunnels of Ahtme, Sompa and Tammiku mines are completely, those of mines Nos. 2 and 4 almost completely water-filled. The rest of the mines (Kiviõli, Kukruse and Käva) contain areas with dry floor. The museum founded in Kohtla mine is dry because of to the draining effect of Aidu opencast and the water barriers surrounding the exposition area. The water level changes depending Technogenic Water in Closed Oil Shale Mines 17 10 15 20 25 30 35 40 45 50 2002 2003 2004 2005 Water level, m Tarakuse well Pagari well Fig. 1. Increase in the water table in closed Ahtme mine on the amount of precipitation and water exchange with neighbouring mines. The rate and amplitude of the changes differ from mine to mine. Several problems have arisen from the flooding of the closed mines. First, the technogenic water body started to affect the amount of the water pumped out of the working mines and its seasonal variation [2]. Clearly, the water of the closed mines will influence also the new mines, planned to be constructed in the Ojamaa and Uus-Kiviõli mine fields. Second, the environ- ment is affected by the water that in several places has risen to the pre- mining level (of the year 1945) and by the new springs formed. Several projects have been undertaken to fight the flooding, and it has turned out that no sufficient source data for mine planning are available. Third, the water of the closed mines is an easily accessible water resource, thus it is important to know and predict its quality [3]. Prediction of the mine water quality is essential also because of the fact that groundwater elevation in the mine field has started to affect the water supply of the region – the water richer in sulphates runs into the outdated and leaky common wells. It has also been prognosticated that if the groundwater table rises higher than 45–47 m, the water in the Ahtme mine field will affect the water level and quality of the Vasavere intake [4]. Fourth, the land above old mines has subsided and the rocks are fractured, therefore the technogenic groundwater is weakly protected and the contribution of precipitation to groundwater formation is very high. Water level The present study is based on the water level measurement data (incl. archive data) provided by the Estonian Oil Shale Company, Geological Fig. 2. Map of the technogenic water body Technogenic Water in Closed Oil Shale Mines 19 Survey of Estonia and Municipality of the town of Jõhvi. The water levels of the Keila–Kukruse, Lasnamäe–Kunda and Nabala–Rakvere aquifers, closed mines and main outlets were measured on an average period of 20 years. New data were obtained in the years 2003 and 2004. Field works and monitoring started in the spring of 2004 and are still going on. An essential part of the research was the modelling of the level of the Keila–Kukruse aquifer in the stationary regime. The modelling area included the central part of the deposit – underground mines and Aidu opencast. Data from about 50 observation wells were used. The water level of working mines was described at the level of the oil shale bed floor. Closed mines were treated as independent water sub-bodies, where the water level is constant at a certain moment of time (Table 1). The MapInfo Professional software was used, combined with the modelling package Vertical Mapper. The comparison and calibration of the intermediate results obtained and discussions held showed that the best interpolation method was triangulation with smoothing, because in that case interpolation takes place only between data points or observation wells, without modelling the situation outside the study area. During the first stage of the research the state of the water body in August 2004 was assessed. According to the measurements and calculations performed, precipitation accounts for up to 70% of the water pumped out of mines [2]. The autumn–winter season of 2004 was rich in precipitation, with little snow and relatively warm. Therefore it could be expected that Ahtme mine would fill with water sooner than predicted [4]. To check that hypothesis, the model was calibrated at the second stage of the research in December 2004. The contour map of the modelled water table is shown in Fig. 2. By continuous improvement of the existing and addition of new data more than ten two- and three-dimensional map versions were completed. The model enabled us to assess the water levels in different mines and their border areas and to make assumptions and predictions about the water move- ment directions. Water quality In the years 2000–2004 the department of environmental services of the Estonian Oil Shale Company had the waters of all closed mines analysed. The samples were taken at six sites in four mines in different seasons. Analyses were made at the central laboratory of the Estonian Oil Shale Company (3 analyses), in Tartu Environmental Research Ltd. (2 analyses) and in the Geological Survey of Estonia (12 analyses). Up to 16 quality parameters were determined. The results of the analyses are presented in Table 2. The quality parameters are arranged in Table 2 in the decreasing order of the variation in measurement results. At first glance only the average contents of iron, sulphates and phenols obtained for the observation period do not meet the drinking water standards. This cannot be a final conclusion. The average Table 2. Water quality parameters in closed Ahtme, Kohtla, Sompa and Tammiku mines Quality parameter Unit Number of measurement results Numerical data for the entire period (2000–2004) Leachates Total Certain numerical values Arithmetical mean Standard deviation Variation coefficient Max. levels permitted in drinking water Total Fe mg/l 14 10* 0.69 1.16 1.67 <0.2 NO3 - mg/l 15 11* 11.7 18.55 1.58 <50 NO2 - mg/l 12 7* 0.015 0.0166 1.10 <0.5 SO4 2- mg/l 15 15 342.4 240.2 0.70 <250 Dry residue mg/l 14 14 845.5 569.6 0.67 – Mg2+ mg/l 15 15 51.6 32.58 0.63 – K+ mg/l 13 13 12.9 8.11 0.63 – Ca2+ mg/l 15 15 174.5 107.6 0.62 – Na+ mg/l 14 14 10.4 6.33 0.61 <200 Cl mg/l 15 15 16.4 9.74 0.59 <250 Total hardness mge/l 13 13 13.72 7.04 0.51 – Oil products mg/l 15 4* 0.15 0.073 0.49 <0.05 Conductivity μS/cm 14 14 1095 477.6 0.44 <2500 NH4 + mg/l 12 2* 0.017 0.0064 0.39 <0.5 Total phenols mg/l 15 4** 0.0017 0.00049 0.28 <0.0005 pH 15 15 7.1 0.33 0.05 6.5–9.5 * due to the lack of a certain numerical value the result was smaller than the preciseness of the laboratory tests, but not exceeding the limits permitted in drinking water ** due to the lack of a certain numerical value the result was smaller than the preciseness of the laboratory tests, in two cases not exceeding the limits permitted in drinking water; rest of the samples gave no unique result Notes: Quality parameters are ordered according to the variation coefficient. The shaded lines contain the measurement results the average of which does not meet the Estonian drinking water standard. The content of benzo(a)pyrene was measured in 11 samples. The results are not included in the table because no certain numerical values were obtained. In all samples the benzo(a) pyrene content was lower than the permitted maximum value. and standard deviations given in the table have been calculated for all closed mines and for the entire observation period, thus they characterize only the data set and not the quality of water or a particular mine. Variation in the measurement results is caused by influential as well as random factors. Influential factors are the sampling site (mine) and the time span that has passed since the closure of the mine. Let us treat this assumption as a working hypothesis. A random factor is the season when sampling was performed. For example, in the years 2000 and 2001 samples were taken in summer, in 2002– 2004 in autumn. Surely the water quality parameters depend also on the Technogenic Water in Closed Oil Shale Mines 21 location of the sampling site in the mine field. Some part of variations result from the methodology of sampling and laboratory tests. The reliability of iron content analyses carried out in different laboratories could be questioned. The phenol content of mine water, measured repeatedly during mining, has been 0.003 ± 0.001 mg/l, except for Kiviõli mine, which has been strongly affected by chemical industry. Here the phenol content of mine water was 0.38 mg/l [7]. For preliminary checking of the working hypothesis we conducted a two- factor (place and time) variation analysis of the sulphate and iron contents of Tammiku and Sompa mine waters. The results of sulphate analysis are given in Table 3. We can see that the hypothesis of the influence of place and time on the sulphate content of water is relatively strong (probability of a counter- hypothesis 18.0 and 18.8% respectively). The residual standard deviation (187 mg/l), however, is too large for making definite conclusions. Obviously the result is influenced by taking samples in different seasons. An analogous result was obtained by the variation analysis of the iron content, whereas the impact of time turned out to be small. Possibly this could result from the treatment of samples in different laboratories. In spite of great uncertainty of measurement, the sulphate and iron contents decrease with time. This trend is depicted by graphs in Fig. 3. As could be expected, the purification of water is best described by the exponential function. The constants in the formulae (801 and 0.77 mg/l, respectively) characterize the average concentrations at the initial moment of the dilution process (at the closure of mines) and the time factors (–0.386 and –0.507, respectively) show the rate of water purification. The half-life of the concentration calculated on the basis of time factors, i.e. the time period during which the content of a component decrease twice, is about 1.8 years for sulphates and 1.4 years for iron. From the half-life and graphs we may presume that in about five years after the closure of a mine the content of sulphates and iron decreases below the maximum permitted level in drinking water. The highest permitted content of iron in first-class drinking water is 0.2 m/l and that of sulphates 250 m/l. The data on all mines are included in the graphs of Fig. 3. The measure- ments revealed varying initial concentrations of sulphates for different mines. The highest concentration was recorded in the first sample from Ahtme mine, the lowest in Kohtla mine. Actually, this is not the initial level, since the first samples were taken 4–11 months after the pumps had been stopped. Approximating the results obtained from the samples of each mine separately, we get theoretical dilution of the initial concentration level at the zero moment, about 2200 mg/l for Ahtme and 300 mg/l for Sompa. These values refer to a relation between the depth of the mine and the initial concentration of sulphates. The hydrogeological background of this pheno- menon is discussed by Erg [3]. Table 3. Results of the variation analysis of the content of sulphates Source of Variation df MS F P-value Mines (Tammiku, Sompa) 1 91681 2.63 0.180 Years (2002–2004) 4 92788 2.66 0.183 Error 4 34924 Residual Standard Deviation 187 mg/l Total 9 SO4 2- = 801 e-0.386 t, mg/l R2 = 0.46 10 100 1000 10000 01234567 t - closed, years SO42- - sulphate content, mg/l 250 mg/l Fe = 0.77 e -0.509 t , mg/l R2 = 0.39 0.01 0.1 1 10 01234567 t - closed, years Fe content, mg/l 0.2 mg/l Fig. 3. Decrease in the content of SO4 2- and Fe in closed mines. 250 mg/l and 0.2 mg/l – maximum permitted levels in drinking water. The water quality parameters for which we had at least 14 reliable measurement results (pH, electric conductivity, total hardness, Cl- , dry Technogenic Water in Closed Oil Shale Mines 23 residue, Na+ , Ca2+, Mg2+, K+ and SO4 2- ) were subjected to correlation analysis. From the analysis we could conclude the following: • The content of sulphates can be considered a good indicator of mine water quality, because it correlates well with most of the other water quality parameters, except for K+ . • Electric conductivity can be successfully used for rapid assessment of water quality, because it correlates well with sulphates as well as with other main parameters (except for K+ ). • pH is not informative enough, because it does not correlate with any other water quality parameter. Pilot model of water exchange Continuous water exchange is going on between the closed mines. The water penetrating into mines is derived mostly from precipitation, less from groundwater. The part of the water not flowing out of the mine (Table 1) infiltrates into the neighbouring mines or feeds aquifers. The water pumped out of the working mines is formed of precipitation, groundwater and the water coming from closed mines. Intensity of water exchange depends on the length (L, km) and thickness (l, m) of the barrier left between the mines, difference between the water levels of neighbouring mines (dh, m) and permeability of the barrier and overburden (km, m2 /d). The longer and thinner is the barrier, the greater is the water level difference in neighbouring water bodies, and the higher is the permeability of rocks in the areas separating the mines, the more intensive is the exchange of water. The water levels of the closed mines are precisely known. The measure- ments of barriers can be obtained from the plan of mining works, but the length and thickness of the barriers are highly variable. Little data are available on the permeability of pillars and bedrock. As seen in Table 4, the permeability of the Keila–Kukruse aquifer differs up to 10 times within the limits of the deposit. Water permeability is largely affected by the geological disturbance of the Earth crust (mostly karst zones), which makes the aquifer highly aniso- tropic [8, 9]. In the Estonia mine field twofold difference in the permeability in the northeastern and southeastern directions has been recorded. According to the data by Domanova, anisotropy is especially great in the area of tectonic dislocations, where permeability in various directions may differ several times. Water exchange between the mines is inhibited by extensive karst zones running along the mine field boundaries between Sompa and Viru, and Ahtme and Tammiku mines. At the same time, karst zones running transversely to the mine boundary increase the water exchange between Sompa and Kohtla mines. Additionally, the water exchange is affected by the properties of the mined area, which depend on the roof handling methods used. In the area Table 4. Permeability of the Keila–Kukruse groundwater aquifer in the mining district Filtration module Publication District Permeability, m2 /d Estimated difference in water tables, m m/h m/d Kohtla – Aidu, northern part 1200 5 10 240 Kohtla – Aidu, central part 780 10 3.25 78 [8] Kohtla 6–60 Viru 10–40 [7] Aidu, generalized 393 10 1.6 39 Ahtme, generalized 335 10 1.4 34 [4] Tammiku 4–20 Ahtme 1–15 [7] Ahtme – Estonia 90 10 0.38 9 [4] No. 2 – Tammiku 0.24 6 [10] mined using roof caving the water-bearing horizon is thicker and of higher permeability than in the area of room-and-pillar mining. Because of high uncertainty the calculation of the water amounts moving between the closed mines is complicated, not only due to the variability in L, l, k, but also due to the lack of the relation uniquely describing all the situations. Therefore the present study makes use of the balance method, which unites the amounts of the water pumped out of the working mines, and of precipitation and groundwater infiltrating into the mine. The relation between these amounts is expressed by the approximate formula qij = 365.25 × Lij × kij × (dhij/2) / (1000 × lij), where qij – the amount of the water migrating from one mine (i) to the other (j), million m3 /y, Lij – length of the barrier between these mines, km, lij – average thickness of the barrier, m, dhji – difference between the water levels of two closed mines at the moment of modelling, m, kij – factor characterizing the permeability of the area between the mines (barriers and overlying rock), which, with some reservation, can be considered as generalized permeability, m2 /d. As model input we use the measurements of the barriers between the mines, volume of the water pumped out of the working mines (especially changes in it due to the closure of neighbouring mines), amount of precipita- tion and its relation to mine pumping [2]. The variable parameter of the Technogenic Water in Closed Oil Shale Mines 25 model is generalized permeability, which is used to balance the model. Permeability was fitted into the model taking into consideration the informa- tion available (Table 4), location of mines with respect to tectonic fault zones and the orientation of the karst zones lying between the mines. The balanced model can be used for calculating the migrating water amounts by fluctuations in water level, for example during floods and heavy rains, but also for planning water level regulations. The model output is the matrix of water exchange (Table 5), where • “North” denotes the northern closed mines No. 2, Kukruse, and Käva and its satellite mines • “West” denotes the western closed mines Kohtla, Sompa and No. 4 • “Vasavere” is the area east of Ahtme and Estonia mines • The water amounts in the matrix of water exchange are given in million m3 /y, whereas (+) shows the amounts infiltrating into the mine (i) from the mine (j) and (–) shows the amounts migrating from the mine (i) to the other mine. Explanations to the matrix of water exchange are given in Table 6. Water movement inside the water body and the amounts of mine pumping are shown in Fig. 1. The values presented characterize the state of the water body in the year 2004, but as we have to do with a pilot model, these are all approximate. Table 5. Matrix of water exchange, year 2004, 106 m3 /y ↓Elements of the water body → Aidu Estonia Viru Ahtme Tammiku North West Vasavere Jõhvi city Sum Working mines: Aidu 0.00 0.00 0.00 0.00 0.00 0.00 14.46 0.00 0.00 14.46 Estonia 0.00 0.00 1.64 6.48 0.00 0.00 0.00 0.48 0.00 8.60 0.00 0.00 –1.64 0.00 0.18 7.23 0.00 3.07 0.00 0.00 8.83 Technogenic water body; closed mines (sub-bodies): Ahtme 0.00 –6.48 –0.18 0.00 0.07 0.00 0.00 –1.07 0.00 –7.65 Tammiku 0.00 0.00 –7.23 –0.07 0.00 2.28 –1.69 –0.50 0.00 –7.22 North 0.00 0.00 0.00 0.00 –2.28 0.00 –4.60 0.00 –0.15 –7.03 West – 14.46 0.00 –3.07 0.00 1.69 4.60 0.00 0.00 0.00 –11.24 Geographical sites: Vasavere 0.00 –0.48 0.00 1.07 0.50 0.00 0.00 0.00 0.00 1.09 Town of Jõhvi 0.00 0.00 0.00 0.00 0.00 0.15 0.00 0.00 0.00 0.15 Table 6. Water exchange between mines Mines, techno- genic water sub-bodies and geographical sites Water exchange, 106 m3 /y Comments Working mines: Aidu 14.46 Inflow from closed Kohtla mine Estonia 8.60 Main inflow from closed Ahtme mine, less from the direction of working Viru mine, partly also from the east Viru 8.83 Inflow from closed Tammiku and Sompa mines, slight outflow into Estonia mine Technogenic water body; closed mines (sub-bodies): Ahtme –7.65 Outflow mainly into Estonia mine and into the catchment area of the Pühajõgi River through springs and outflow wells Tammiku –7.22 Intensive water exchange with other parts of the water body, out flow into the catchment area of the Pühajõgi River through a caving at Kose Northern closed mines Käva, Kukruse and No. 2 –7.03 Feeds other closed mines, outflow via Vahtsepa ditch into the Kohtla River Western closed mines Kohtla, Sompa and Mine No 4. –11.24 Intensive water exchange with other parts of the water body, feeds mostly Aidu opencast Geographical sites: Vasavere 1.09 Water inflow mostly from Ahtme mine, to some extent also from closed Tammiku mine Town of Jõhvi 0.15 Water infiltrates from closed mine No. 2 Conclusions and recommendations No great changes in the water level of closed mines and its seasonal variation are expected if no measures are taken. The situation should not change after the closure of presently working mines either. In future the water level of flooded Aidu opencast will be regulated by an outlet into the Ojamaa River at 40–42 m level, which will be also the common water level in Kohtla and Sompa mines. In the area of Viru and Estonia mines the groundwater will rise to the pre-mining level, which will result in an increase in groundwater flow into the Pühajõgi River at the eastern margin of Tammiku and Ahtme mines. It may turn necessary to regulate water level in the mining district. In order to reduce the flow of groundwater from mine No. 2 to the lower, area of the town of Jõhvi, the following options could be considered: • outlet of water at 51 m level at the northern boundary of the mine, near the adit of unbuilt mine No. 1 Technogenic Water in Closed Oil Shale Mines 27 • blasting of the barrier between mine No. 2 and Käva and Tammiku mines to enable water outflow towards the Kohtla River (at a level of 51 m) or into the Pühajõgi River (at 45–47 m level) • building of a pumping station regulating the water level and operating seasonally, but this is evidently not efficient due to great expenses. In order to reduce the water amounts penetrating into working mines and towards Vasavere intake, it would be purposeful to lower the water level in several closed mines: • to 45 m level in Tammiku mine, by dredging the present outlet • to 42–43 m level in Ahtme mine, by drilling artesian wells The quality of the water of closed mines is improving. The content of sulphates and iron in mine water decreases and in about five years after the closure of the mine is below the maximum level permitted in drinking water. Monitoring the water quality in closed mines should be aimed mostly at protecting the water body from surface-derived pollution. The sampling methods should be improved, with indicating justified times and places for taking water samples. In some cases the number of parameters measured could be reduced. As no reliable data are available about the formation and distribution of phenols in the water of closed mines, corresponding investigations are needed before the use of the water. Although phenols are generally believed to originate from the waste of shale oil plants or from burning spoil dumps, the possibility of their formation during decomposition of kerogen in water- filled mines cannot be excluded either. This hypothesis deserves further special study. Acknowledgements This paper was written within the framework of Grant 5913 of the Estonian Science Foundation “Usage of mined-out areas”, using the database of research No. 416L “Forecast of hydrogeological changes resulting from the activities of the Estonian Oil Shale Mining Company” carried out by Tallinn University of Technology. REFERENCES 1. Reinsalu, E. Sillamäe uranium mine // Environment Technics. 2001. No. 2. P. 40–45 [in Estonian]. 2. Reinsalu, E. Changes in mine dewatering after the closure of exhausted oil shale mines // Oil Shale. 2005. Vol. 22, No. 3. P. 261–273. 3. Erg, K. Changes in groundwater sulphate content in Estonian oil shale mining area // Oil Shale. 2005. Vol. 22, No. 3. P. 275–289. 28 E. Reinsalu, I. Valgma, H. Lind, K. Sokman 4. Savitski, L., Savva, V. Prognosis of hydrogeological changes in the mining district of the Estonian oil shale deposit, stages 1–3, 2001 [in Estonian] 5. Reinsalu, E., Toomik, A., Valgma, I. Mined out land, Tallinn, 2002 [in Estonian]. 6. Butakova, A., Jürgenfeldt, G., Reinsalu, E. Assessment of the mine water volume of water-filled oil shale mines // Gorjutšie slancy. 1980. No. 1. P. 6 [in Russian]. 7. Parahonski, E. Formation of mine water in oil shale mines and opencasts and mine drainage. Tallinn, Valgus, 1983 [in Russian]. 8. Domanova, N., Reinsalu, E. Analysis of hydrogeological conditions in Oktoobri opencast, Topic 0107, Stage HD No. 1, Estonian Branch of A. Skotchinski Institute of Mining Engineering, 1979 [in Russian]. 9. Domanova, N. Formation and forecast of water flowing into the mine workings driven into carbonate rocks with uneven infiltration properties. Candidate’s thesis, A. Skotchinski Institute of Mining Engineering, 1986 [in Russian]. 10. Domanova, N. Predicted increase in the water inflow into Viru mine due to the flooding of Tammiku mine. Estonian Oil Shale Company, Jõhvi, 1999. Manu- script [in Russian]. Recieved June 20, 2005
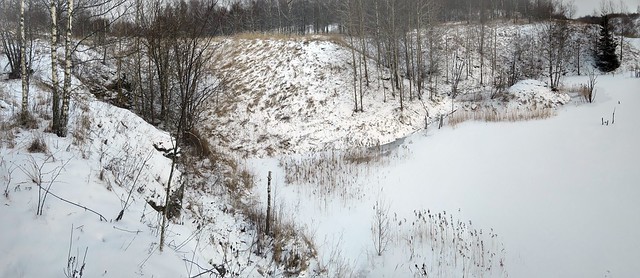
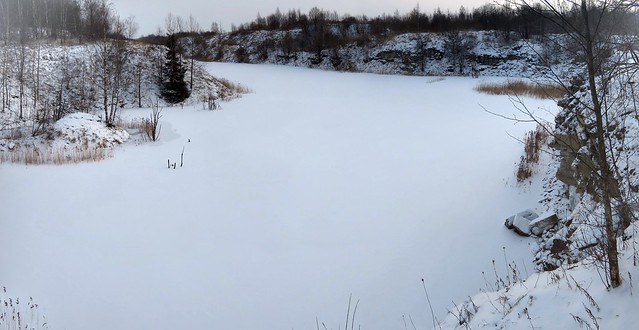
Kas veespordikeskust tehakse karjääridesse või karjääri? Või kas nn Aidu fjordid on karjäärides või karjääris?
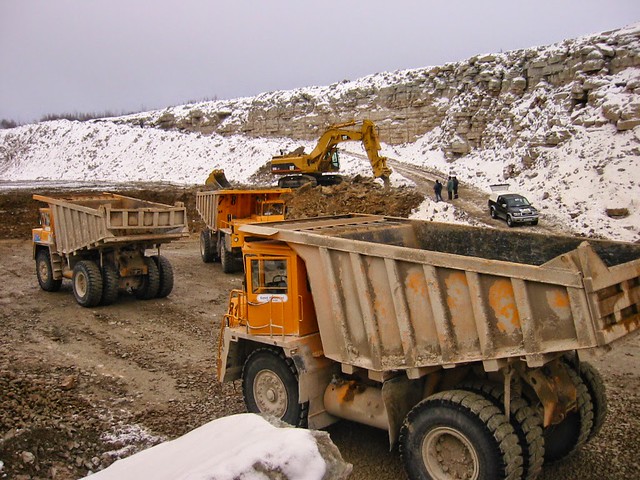
Karjääriks nimetatakse ala, kus kaevandab ettevõte. Ettevõttel võib olla ka mitu ala ja siis võib neil aladel olla erinev nimi ehk karjääre võib olla mitu. Võib olla ka üks karjäär mille sees kaevandavad mitu ettevõtet. Seega asi võib olla segane ja olukord võib muutuda.
Aidus ei ole karjääre vaid on üks karjäär kus on mitu tranšeed.
Aidust põhjas oli kunagi ammu ka Kohtla karjäär ja idas oli ka kunagi Kohtla karjäär mis kuulus hoopis Kohtla kaevandusele.
Aidus ei ole kaevanduskanalit. Kaevanduskanal on vilets mõiste kuna sellest ei ole üheselt aru saada mis see on. Aidus ei ole kaevandust. Aidu karjääri all on käigud mida kasutati veekõrvalduseks ja nimetati veekõrvaldusstrekkideks. Kaevanduses, näiteks Aidu karjäärist idas ja lõunas asuvas Kohtla või Ojamaa kaevanduses on küll strekkide põhjas kraavid või sooned, mida mööda vett juhitakse ja mida võiks nimetada kaevanduse kanaliteks aga ei nimetata kuna kanali mõõtmed on pigem suured kui väikesed.
https://ingo-valgma.blogspot.com/search?q=Aidu